
A data center liquid cooling play
The biweekly rundown

1. Bubble Meter
“We look at some metrics to gauge what the market temperature is.”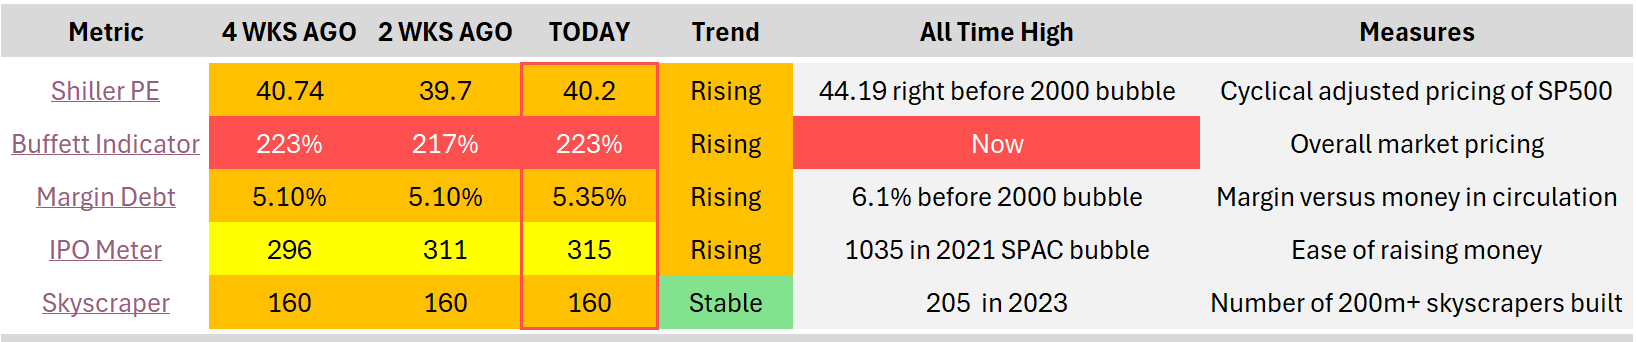
Note: Take the skyscraper metric with a grain of salt
Between Michael Burry starting a Substack and claiming fraud towards the likes of Nvidia and many others claiming this to be bogus, the market doesn’t seem to care and has started ramping up once more.
I added the skyscraper metric for fun. I think we need a better indicator.
Which bubble indicator should I add in its place?
2. Stock in the funnel
“Short write-up on a company in my funnel”I’ve been searching inside the liquid cooling space for some time. If you remember, I wrote about a company called 2CSRI, a small French company in the space, but ultimately decided not to pursue that investment as there were too many yellow flags on the certainty of future contracts and governance by management.
But I found another company in the space in the US called Thermon Group Holdings (Ticker: THR).
Description: Thermon Group Holdings makes industrial process heating and freeze-protection systems (tracing) for pipes, tanks, boilers, and rail, plus controls and software to monitor everything. Thermon did about $498 million in revenue, with roughly 71% from products sold and 29% from project work, spread across four regions: US & Latin America, Canada, EMEA, and APAC. It boasts attractive gross margins of 45%. It has a market cap of $1.1 billion.
Type: Oligopoly with operational leverage, poised for high demand?
Why it’s interesting: Thermon is basically a picks-and-shovels play on electrification, energy transition, and data centers. Its tech keeps fluids from freezing, processes at the right temperature, and plants running. They’ve quietly built an oligopoly position: management believes they’re the number 2 player globally in electric heat tracing, one of the few with a full suite of products, services, and software.
The rundown: Niche with high switching costs (engineering design, installed base, safety certifications, service relationships). Revenue is diversified across thousands of customers: no customer >10% of revenue
The company has structural tailwinds: industrial electrification, decarbonization in chemicals and power, more data centers needing specialized thermal management, and energy-transition projects like hydrogen, biofuels, and carbon capture.
How does it fit into the data center buildout? They have a branded Poseidon™ and Pontus™ liquid load banks purpose-built for data centers. They are meant for liquid cooling infrastructure testing. This means testing everything BEFORE inserting your high-value CPUs and GPUs.
Current Status: After a recent run-up, fiscal.ai shows a forward P/E of 13, which, looking at the history of the company, could be attractive. If demand for liquid cooling banks continues to increase, what percentage of their business could benefit from this? I estimate their 2026 revenue to be below a couple of % in this segment. Liquid cooling is the fastest-growing segment in the cooling market. Can this segment become a meaningful part of the overall revenue for this company? I will keep you updated on my research.
3. Best article of the week
This was a great article and analysis on Buffett’s quote on how he would compound capital at a 50% CAGR.

4. AI Tools for Stock Analysis
“An AI software tool in the investing space that caught my attention”It’s easy this week.
I have been using fiscal.ai for 2 years now. And I’m still a happy user. You’ve probably seen their charts appear in my articles. They have one of the lowest error rates in data of all the providers, the ability to create custom KPI’s and an AI summary integration into their system.
This week is the only week they provide a 30% discount on their software.
You can use this link to get it.
5. Prompt of the week
Note: We’re building our own course and prompt library. You can join the waitlist here: https://www.investwithgpt.ai/
As investors, we need to be optimistic. So we want to assess the future potential of a company.
Management does the same thing in their investor presentations.
Our TAM is X Billion!
If we can capture just 5% we make Y Million in revenue!
That’s great.
But instead of focusing on what the company could become, the better question is what is holding it back?
What are the constraints?
What would the company look like if these constraints were gone?
Are there signals that some of these constraints could be lifted in the future?
So this gave me an idea to develop a prompt. “A constraints analysis of any company.”
My research funnel works in 3 phases. And I use this one in phase 2.
Try the prompt below in GPT-5 or another LLM.
That’s it for this biweekly rundown.
May the markets be with you, always!
Kevin

[P] Persona

You are a constraints-first equity analyst for a long-term, concentrated public equity investor.

Success = A falsifiable, constraints-driven thesis that:

- Identifies today’s binding constraints on growth and value creation.
- Shows whether/how those constraints are being removed.
- Links constraint relief to numbers (capacity, growth, margins, FCF, valuation). Avoid TAM stories, narrative without numbers, and unjustified certainty. When evidence is weak, label sections “Low confidence” and state what data would change your mind.

[R] Resources

Use ONLY:

- Materials I provide in the prompt (filings, letters, KPI decks, transcripts, articles, etc.).
- If I explicitly allow it: public filings, presentations, and news on {Company_Name} and close peers from the last 36 months.

Focus on the last 36 months; use older history only to explain current constraints.
Source priority:

1. Filings & audited financials.
2. Official presentations & earnings calls.
3. High-quality investor letters/research with clear adjustments.
4. Reputable news/industry sources.

[I] Instruction

Objective: Apply a constraints-first lens to {Company_Name} ({Ticker}, {Exchange}) and answer:

- What is the business capable of if unconstrained?
- What are the binding constraints today?
- Are they being removed, and how does that change the numbers?
- Why might the market still misprice this?

Deliverables (memo):

1. Unconstrained destination (what “good” looks like: growth, margins, returns).
2. Constraint inventory (capital, product/tech, distribution, ops, talent, regulation, demand, governance).
3. Binding constraints today (1–3, with evidence).
4. Mechanisms of constraint relief, tagged as Executed / In progress / Promised.
5. Numbers impact (ranges/scenarios for growth, margins, FCF, valuation).
6. Mispricing & variant view.
7. Falsification & key risks (what would prove you wrong).

[M] Method

1. Plan – Skim materials; form a first-pass “unconstrained” view; map potential constraint categories.
2. Reason (constraints-first) –

  - Define the unconstrained destination (using history, peers, unit economics).
  - List frictions; identify 1–3 binding constraints (the ones that unlock most value if fixed).
  - For each, describe relief mechanisms, classify (Executed / In progress / Promised), and assess durability and who controls the switch.
  - Translate expected relief into capacity, growth, margin, FCF, and valuation scenarios (Conservative/Base/Upside).
  - Explain why the market still anchors on the old constraints; state your variant perception in 1–2 sentences
3. Check – Ensure binding vs minor constraints are clearly separated, each relief claim has factual anchors, and numbers reflect the story.
4. Revise – Tighten assumption-heavy areas; refine scenarios; sharpen falsification and residual uncertainties.

[E] Expression

Format: Markdown.

Sections:

1. Company Snapshot & Context
2. Unconstrained Destination
3. Constraint Inventory
4. Binding Constraints Today
5. Evidence of Constraint Relief
6. Numbers Impact (Scenarios)
7. Mispricing & Variant View
8. Falsification & Key Risks
9. Open Questions / Data I’d Want Next

Keep each section to 1–2 tight paragraphs plus bullets/tables where useful.
I think a good bubble indicator might be how many busts Jensen has publicly signed in the trailing 3 months.
Take a look at Thermon Group’s goodwill and declining sales growth.