
100-Baggers, where are they born?
Chapter 1

As mentioned in this article, I’m doing a crazy project based on new data on 100-baggers. (Aiming for the moon)

Why do yet another 100-bagger study?
I’ve had some back-and-forth discussions on this with Christopher Mayer, the author of the incredible book “100-Baggers”.
Chris mentioned that the following topics could be interesting to research:
Fallen 100-Baggers: Companies that made it, and for some reason eventually failed.
Are dividends an expensive luxury? (as the holy grail is reinvestment, not giving away the cash)
Serial Acquirers: What’s special about these companies? Why do they succeed?
Some other questions I think we need to answer:
The most prominent one: Survivorship Bias. This is something Chris explicitly mentions in his book that he is well aware that he’s not addressing this topic. But even in academic literature (Anna Yartseva), they didn’t address it. The main goal here is to see if we can eliminate factors that are touted as essential for multibaggers but in reality are shared with a lot of other companies.
Probabilities: Based on the past, what are the probabilities of picking a 100 Bagger or a 10 Bagger? Are there ways to increase those probabilities?
Insider Ownership: I’ve read several studies, some saying it matters, and others saying it doesn’t matter. We should be able to close the debate once and for all.
Thematic investing: Do certain sectors develop more multibaggers? How has the rise of the internet influenced the emergence of 100-Baggers? Is software eating the world?
Global perspective: How do 100-baggers emerge worldwide? Are there countries that create an unusual amount of multi- or 100-baggers compared to others?
And I reckon many more questions will emerge from this research. We’ll have to take it step by step.
Today, we’ll take it easy.
From the dataset, we want to see in which sectors the most 100 Baggers are born.
Several of you with experience in data science have reached out to help. I feel humbled, and when I get a better idea of where I want to go with this, I’ll reach out!
I’m glad to say that we managed to extract several data points already, but US-only at this time.
And I’ll probably need some of your skills, as I’ve been cleaning the data this week instead of drawing all the conclusions I wanted.
Still, there are some interesting insights to be had.
We’re not focusing solely on 100-baggers; we created the following cohorts:
100 Baggers
Fallen 100-Baggers
10+ Baggers (10X to 99X)
Fallen 10+ Baggers
The dataset starts in 1995 and currently focuses on the US. The starting date is not arbitrary. The end goal is to learn about the past so we can better invest in the future.
So why then start in 1995? Because of this ⬇️1
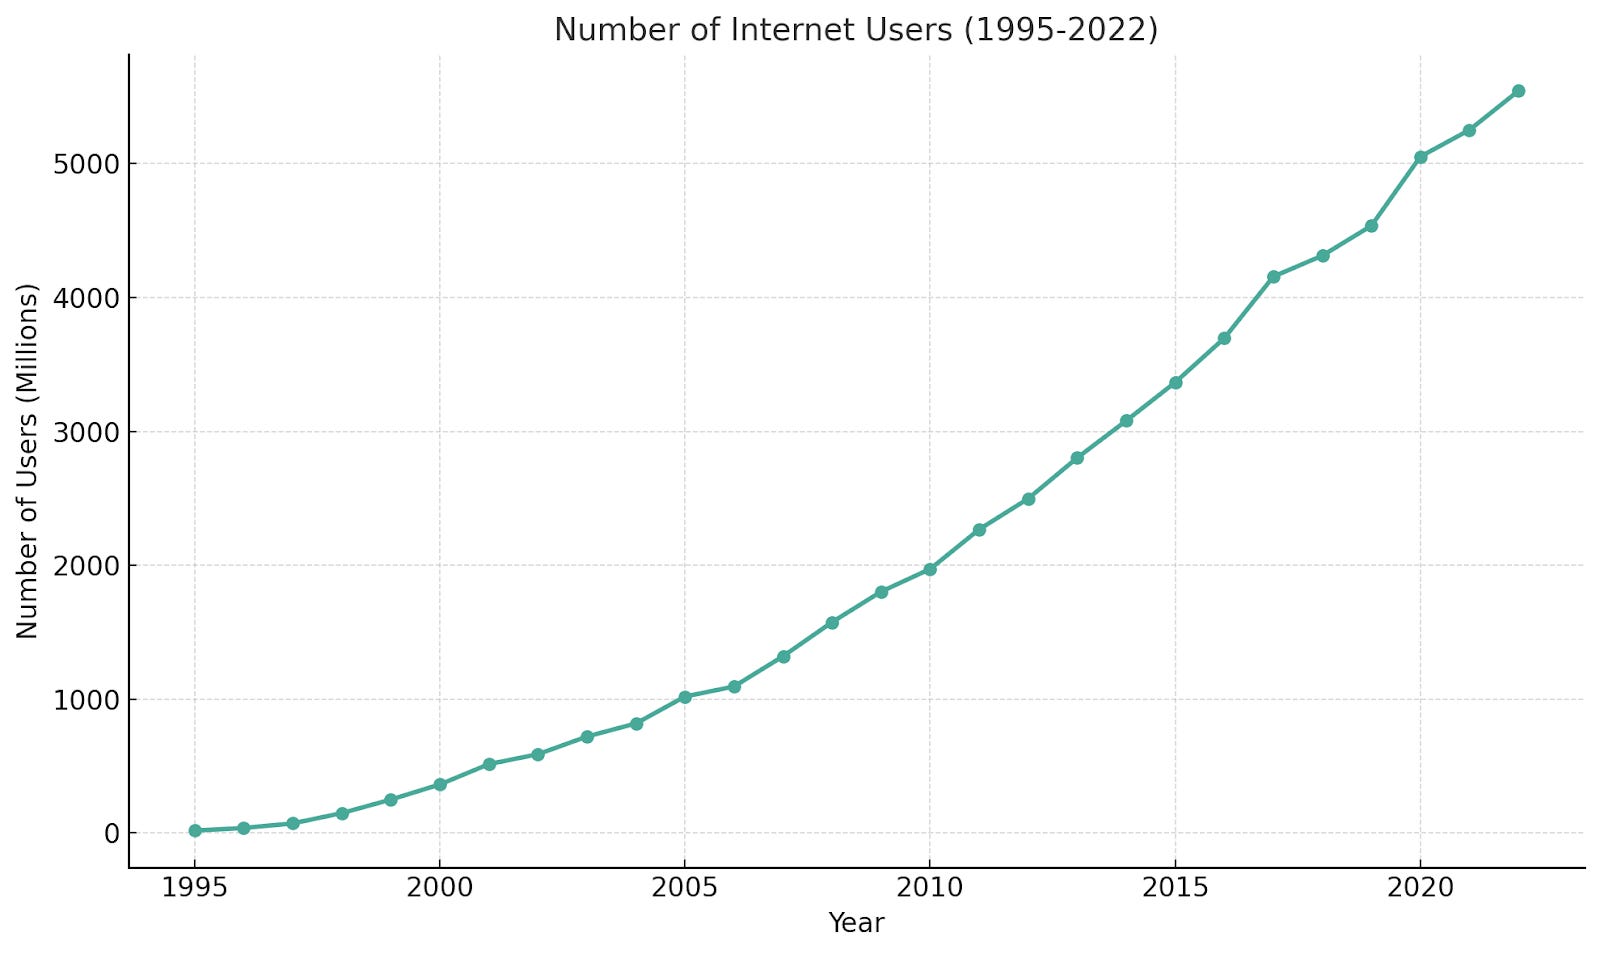
The rise of the internet
The rise of low-capex businesses
The rise of intangibles on the balance sheet
Let’s see what we can learn from this first look.
The cohorts
The idea of cohorts is to see if there are any differences between them. It will be essential once we tackle the problem of survivorship bias in the future.
That’s the main problem most of the studies and books that have been published have.
They take a select number of companies that have wildly succeeded
They analyze what makes these companies special
They define factors that explain this outperformance
Just like in Pharmacy, where you have one group of patients who receive the medicine and one group who receives the placebo, there is a need to somehow remove this survivorship bias from the picture.
Factors like High FCF Yield, High Reinvestment Rate, and the small-cap factor were identified as drivers of outperformance.
And it makes sense.
But it would be useful to look at what those factors did in the companies that ‘didn’t make it’.
Here are the current cohorts we defined:
100+ Baggers (of course)
Fallen 100+ Baggers: Companies that have passed the magical 100x threshold, but for some reason gave it away
10+ Baggers: Companies that multiplied 10 to 99X
Fallen 10+ Baggers: Companies that gave it away
There is no “List of Bankrupt” companies in here, or companies that never went beyond 10X on the public markets.
Maybe we need to add this? What other cohorts do you see?
Let’s see what we can learn…
The numbers
The data
To show you why data cleaning is so important.
From 1995 to 2025, the database gave me over 800 100 Baggers.
I was skeptical because that seemed like a lot. One way is to take a look at the Speed towards 100 Baggerdom.
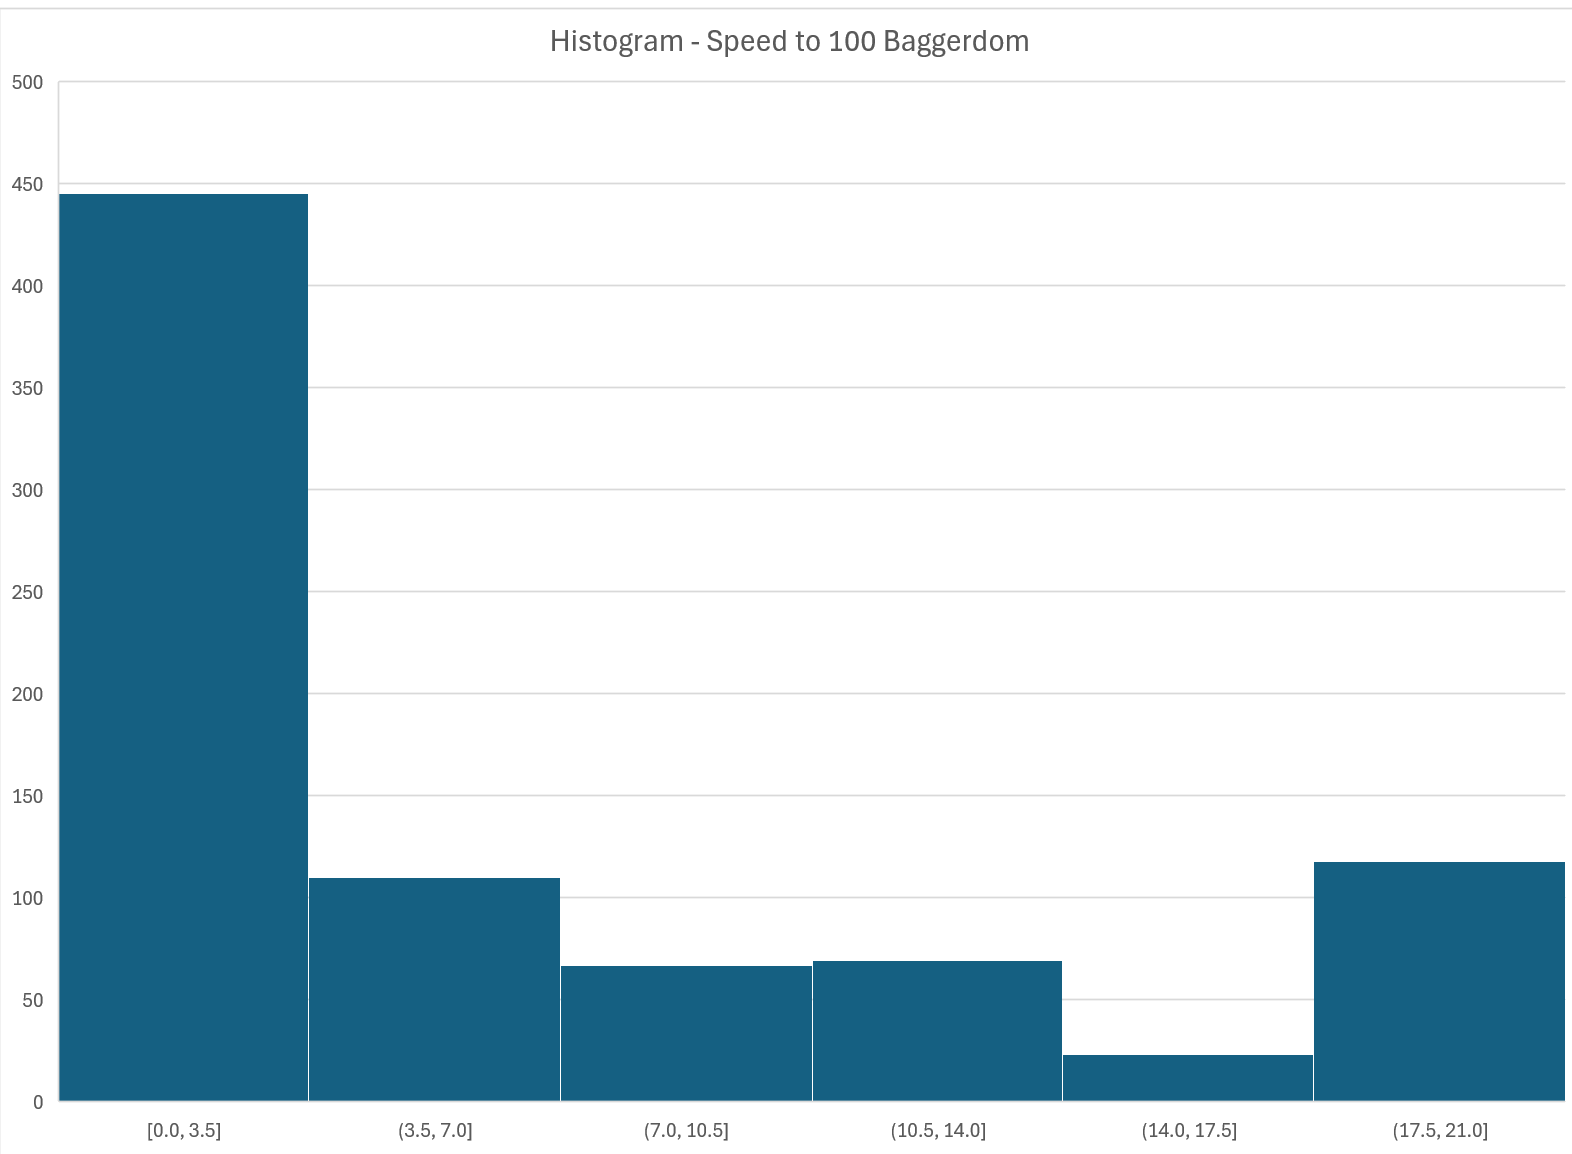
More than half of the companies have reached 100 Bagger status in less than 3.5 years.
That can’t be right.
After analyzing, I believe it’s a data quality problem. Sometimes, the price of a company inexplicably drops to 0.0001 and then rises again. Since our query looks for the lowest to highest price, it captures this.
I might have to parse through the dataset in a more detailed manner in the future, but I’ve decided to add a cutoff: Everything below 10 years will be removed from the 100 Bagger list for now. (and 5 years for the multibaggers)
What is the result on the speed to 100baggerdom?
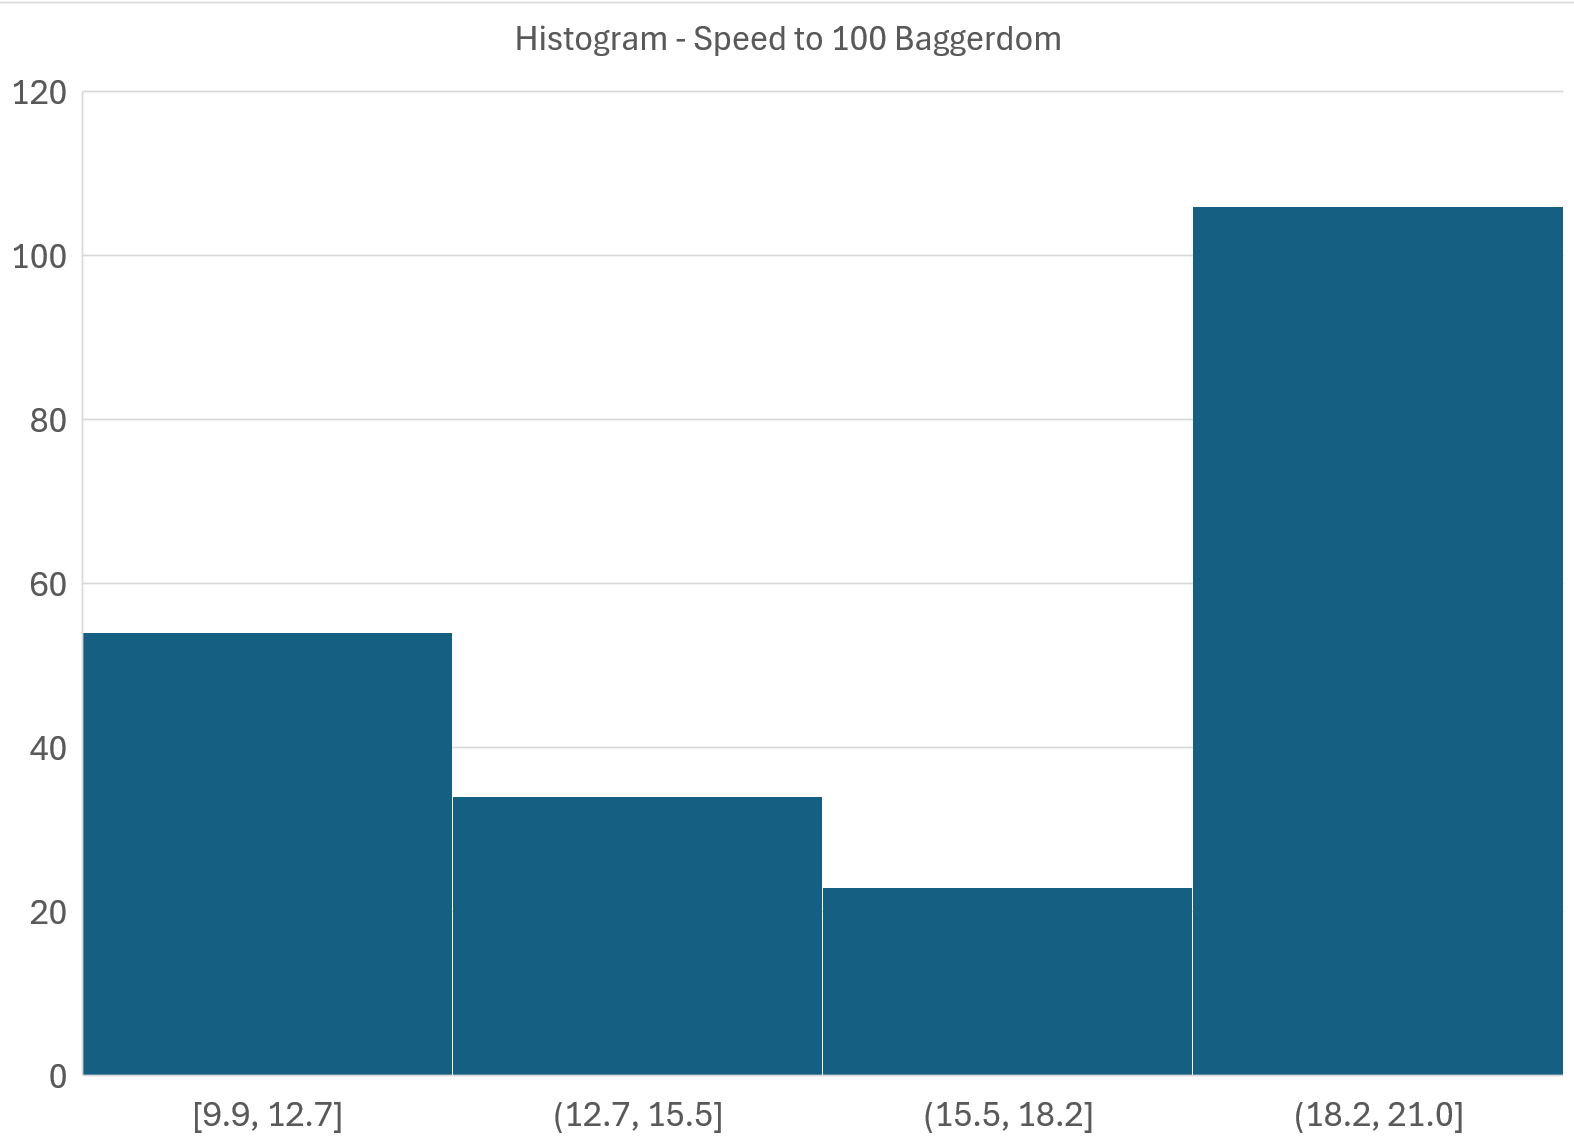
That looks a lot better, with most of the 100 within an 18 to 21-year timeframe.
Just to emphasize, a 100-bagger in 20 years means compounding at almost 26% per year.
In Cris Mayer’s book, the average 100 bagger took 26 years. You can already see that these have compounded a lot faster..
How many?
If you’ve read Thomas Phelps’s book “100 to 1 in the stock market” or Chris Mayer’s 100 Baggers, their dataset, although spanning different periods, delivered exactly 365 100 Baggers.
Here’s what we get:
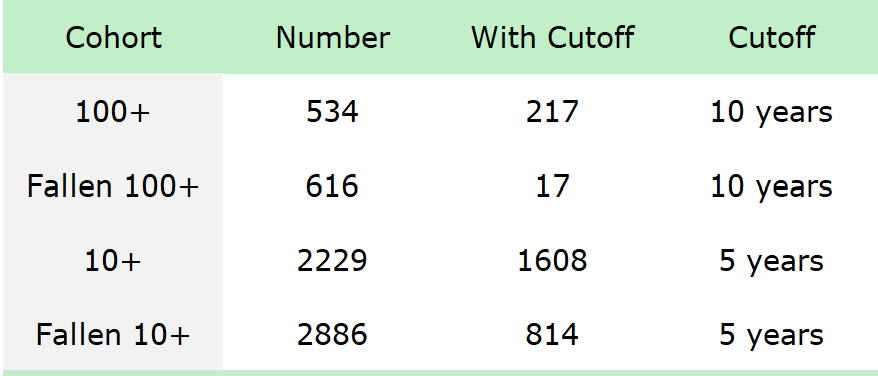
It makes sense that the number of companies that got over 10X would be larger than the 100 Baggers, but the sheer number still surprised me.
Now, for this very first article, we keep it simple.
Where are these 100 Baggers born?
Sometimes, before picking the right company to add to your portfolio, you might want to pick the right industry to fish in first.

Let’s take a look
By industry
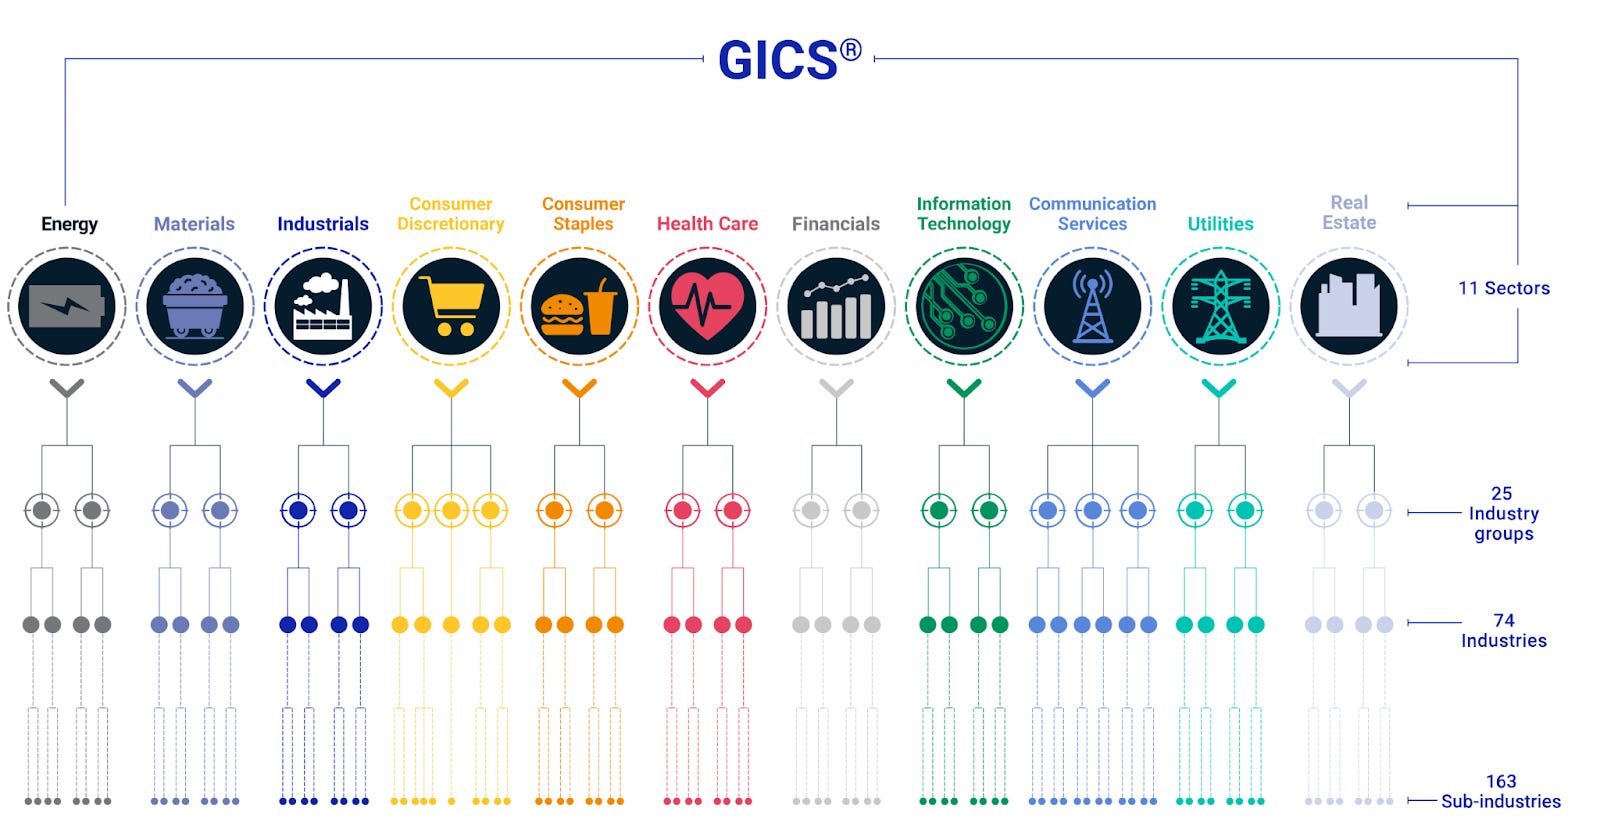
We’ll use the Global Industry Classification Standard to get an idea about industries and sectors.
Here’s what that looks like:2
Let’s look at 2 of the cohorts: 100 and 10+ baggers.
Level 1: By sector
The 217 100-Baggers are divided as such:
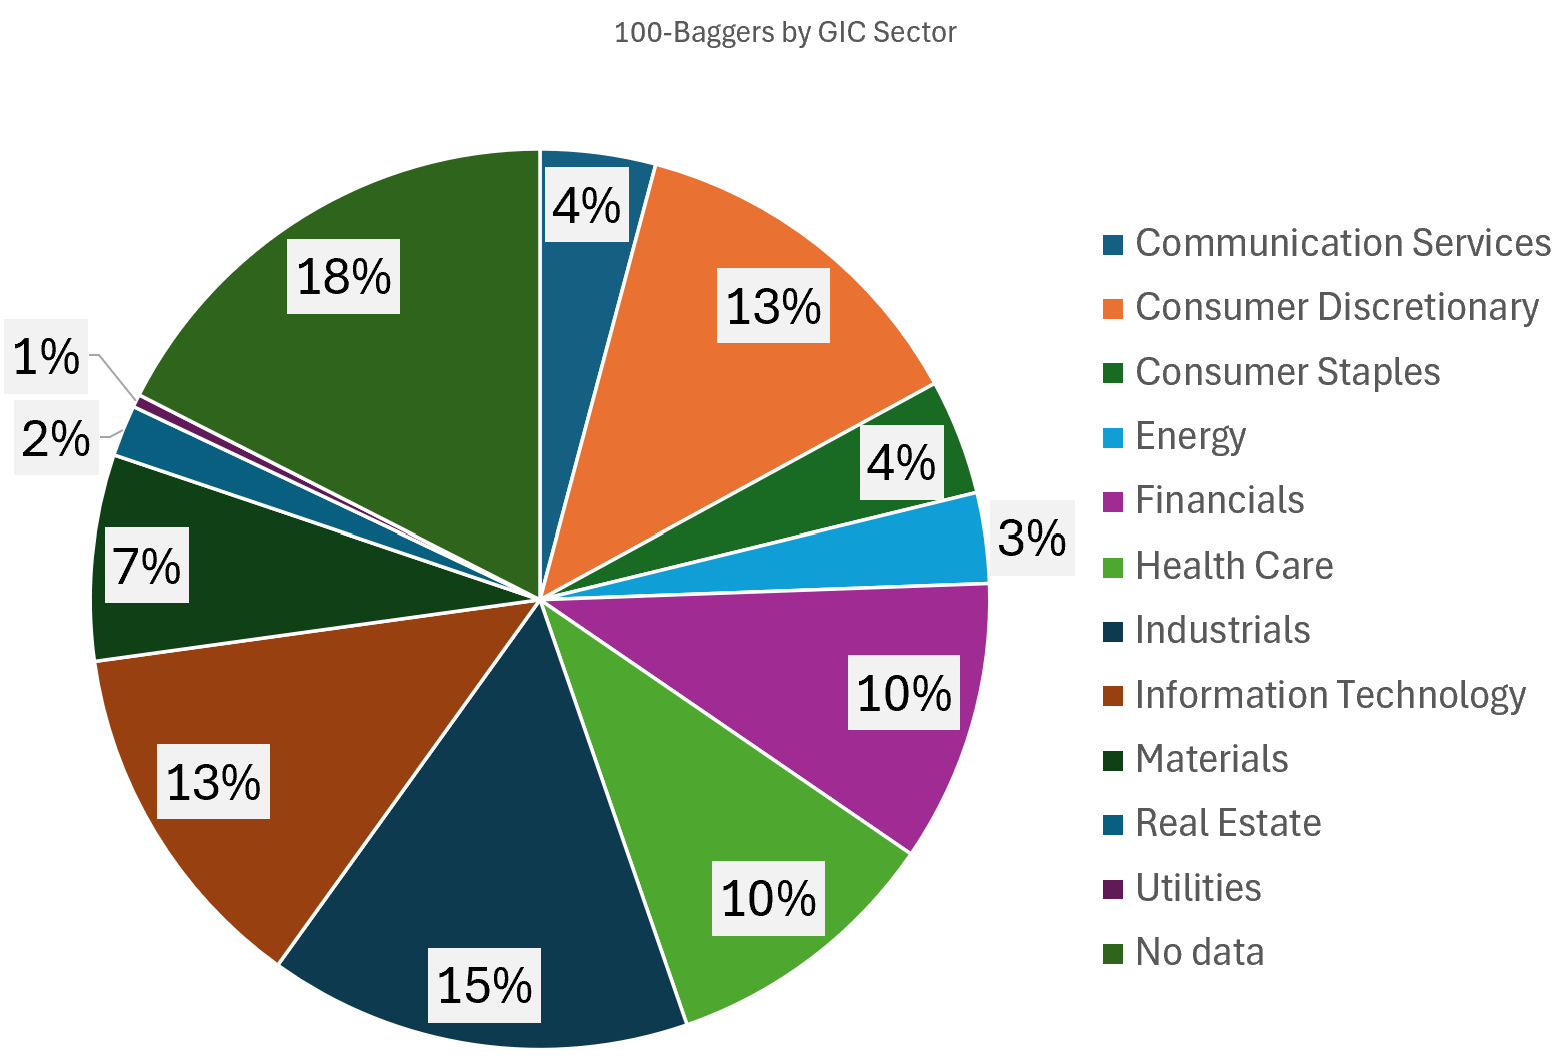
I will need to handle the “no data” later on.
But other than that, no surprises here. The dominant sectors are:
Industrials
IT
Consumer Discretionary
With financials and health care following in their wake.
Let’s increase the sample, and compare this result to the 10+ baggers ⬇️
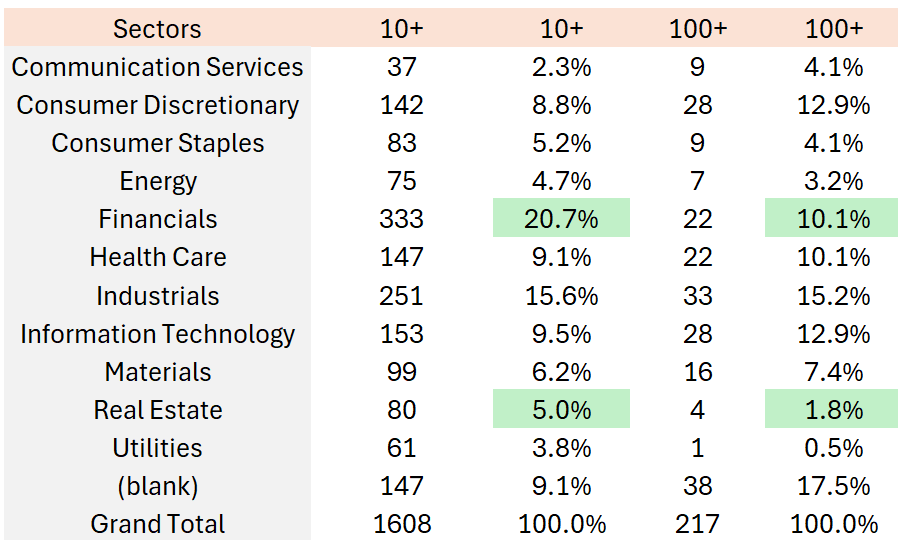
Results are similar, but we see 2 bigger differences:
Financials represent more than double the amount of multibaggers versus 100 Baggers
The difference in the real estate sector is even more pronounced
Let’s go deeper into the industry classification
Level 2: By Industry Groups
When dividing them by industry group, we get the following:
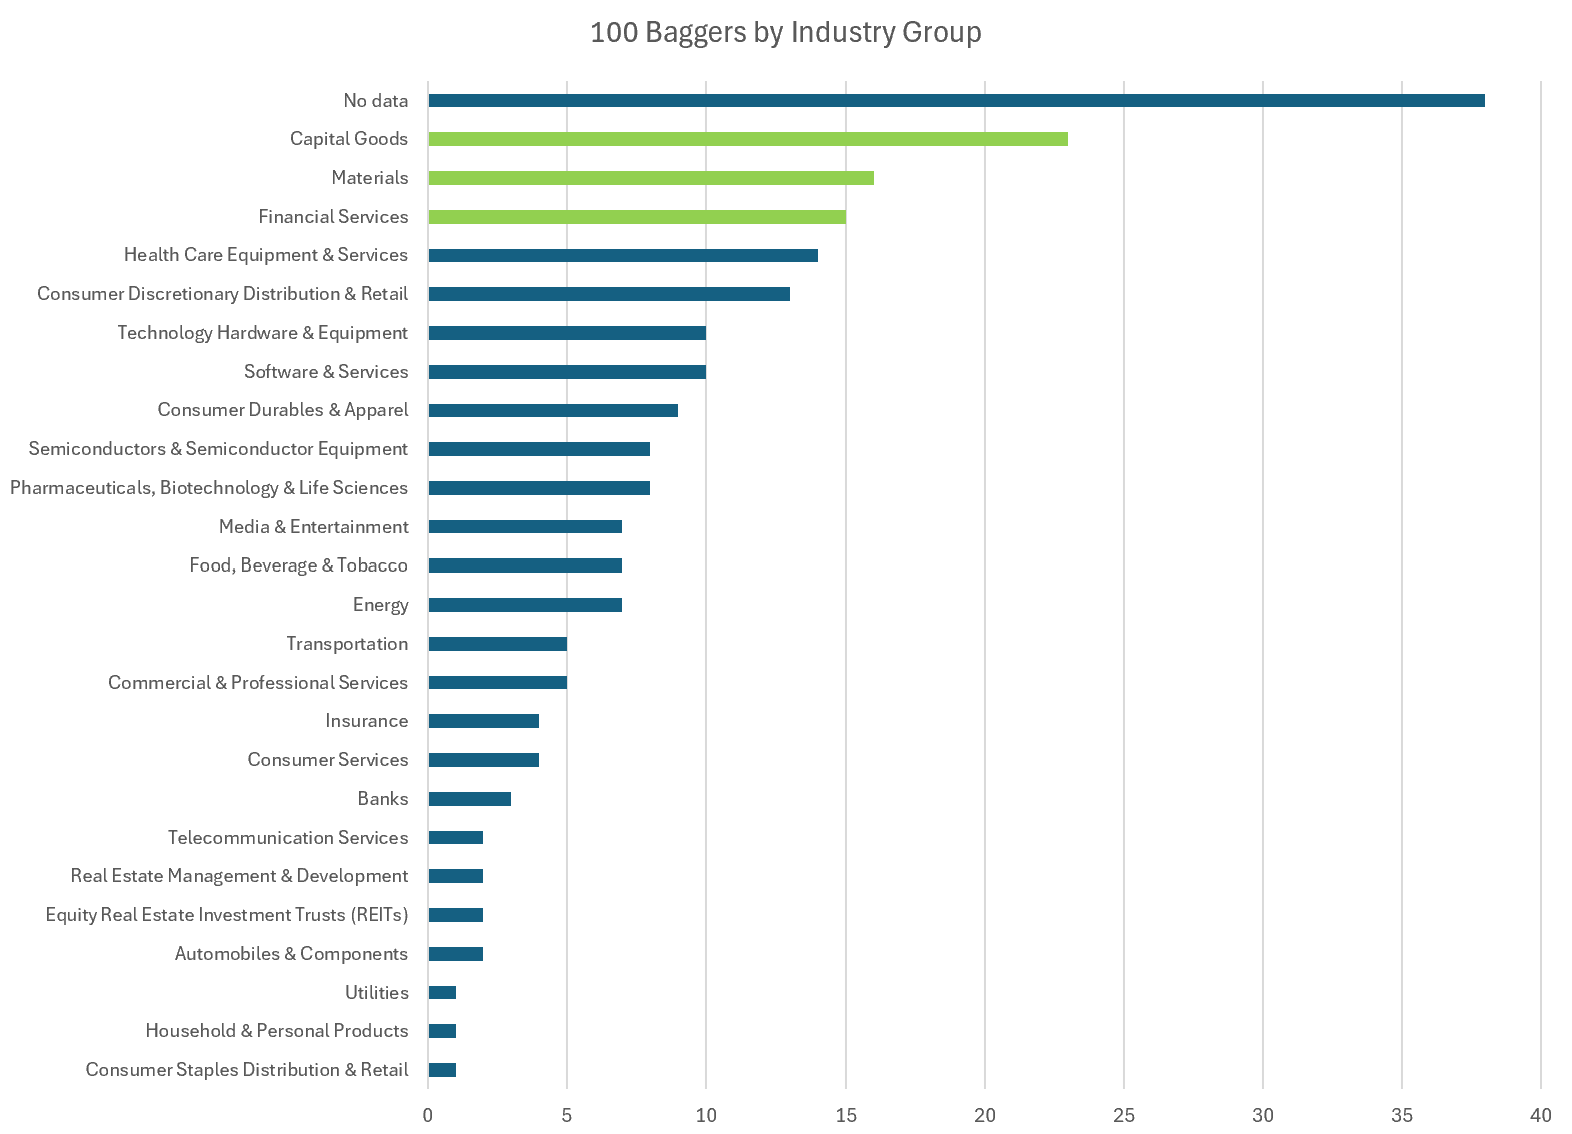
Some sectors don't divide into multiple groups. Materials and financial services are the same as a sector and group. Industrials are dominated by capital goods.
And when comparing 10 baggers to 100 Baggers:
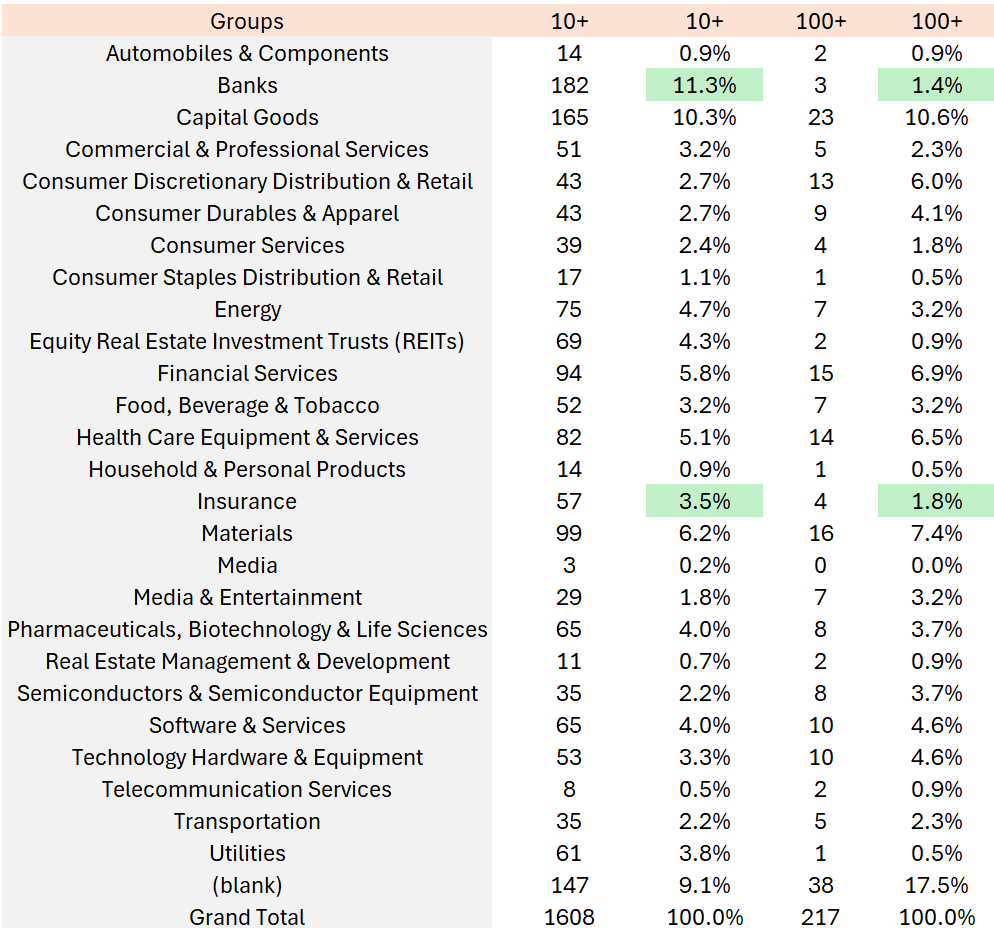
We see the biggest difference in the bank group. Banks have accounted for more than 10% of multibaggers in those 30 years. Together with capital goods, they are the top contributors.
Let’s go one level deeper.
Level 3: By Industry
Here it gets more interesting. It appears 100 Baggers appear everywhere. In no less than 53 industries.
Let’s just look at those that have generated the most:
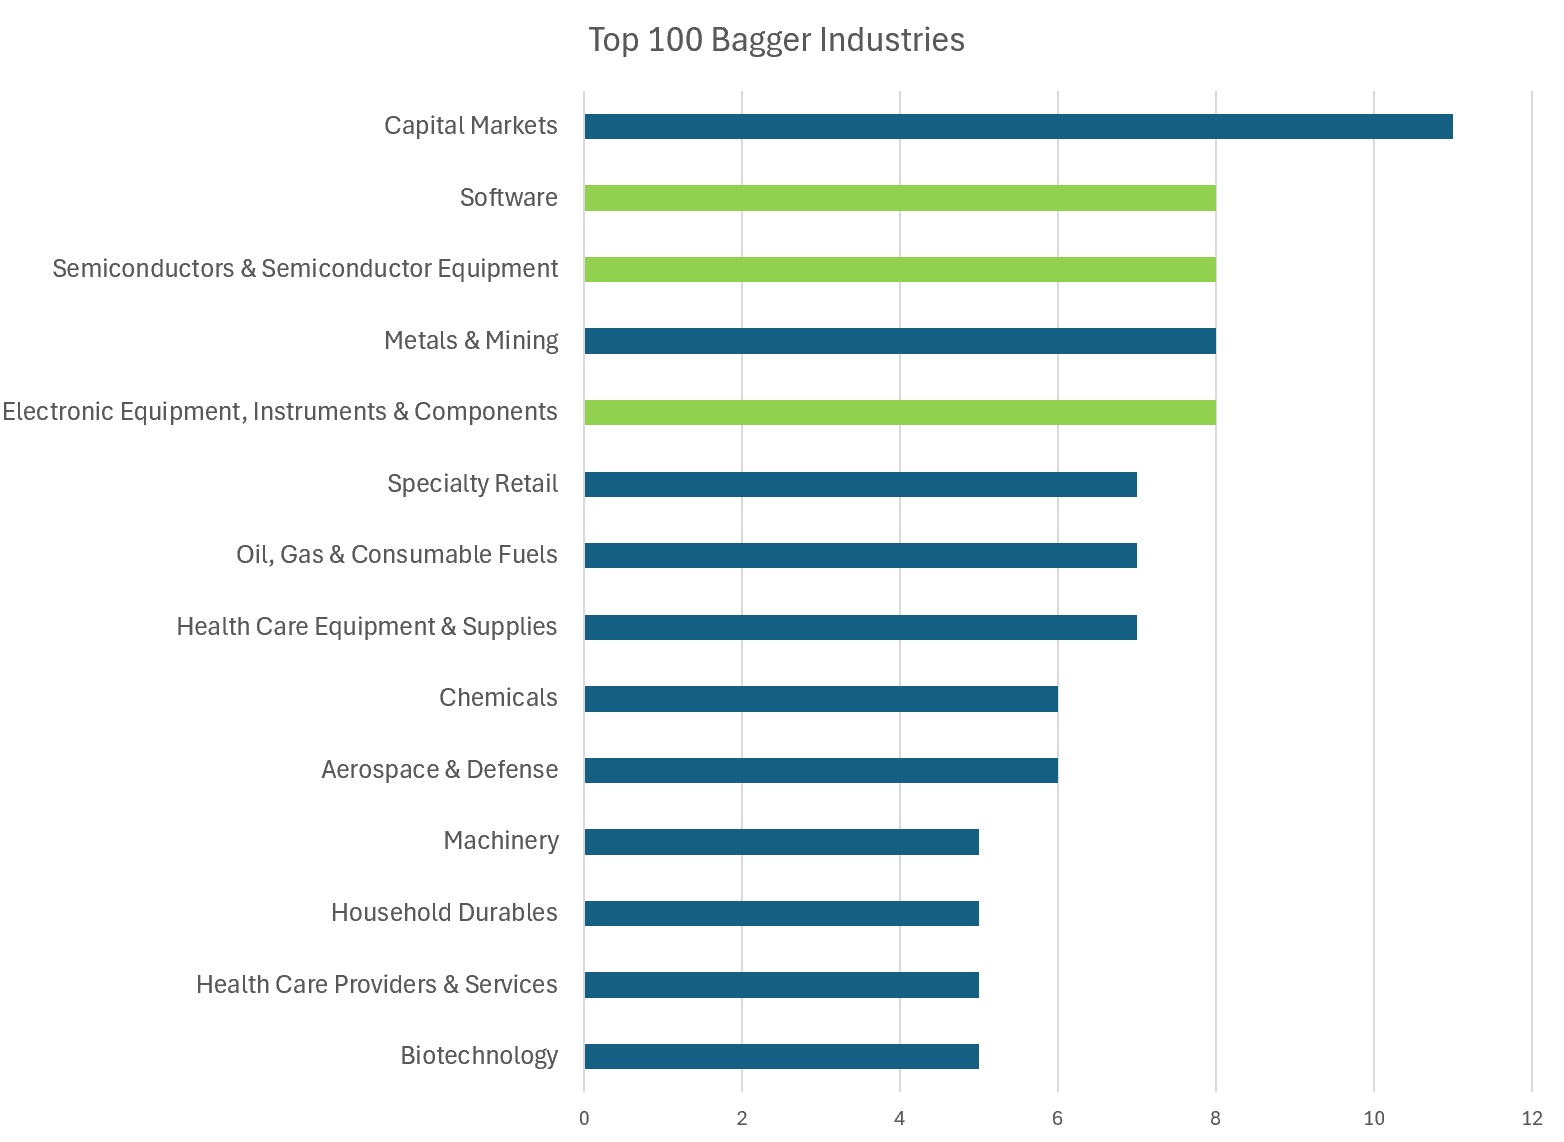
In green are highlighted Software, Semiconductors, and Electronic Equipment.
This makes sense, and more than likely, these are the sectors that will keep on generating the most 100 Baggers in the future.
When we compare to the multibaggers, we get this:
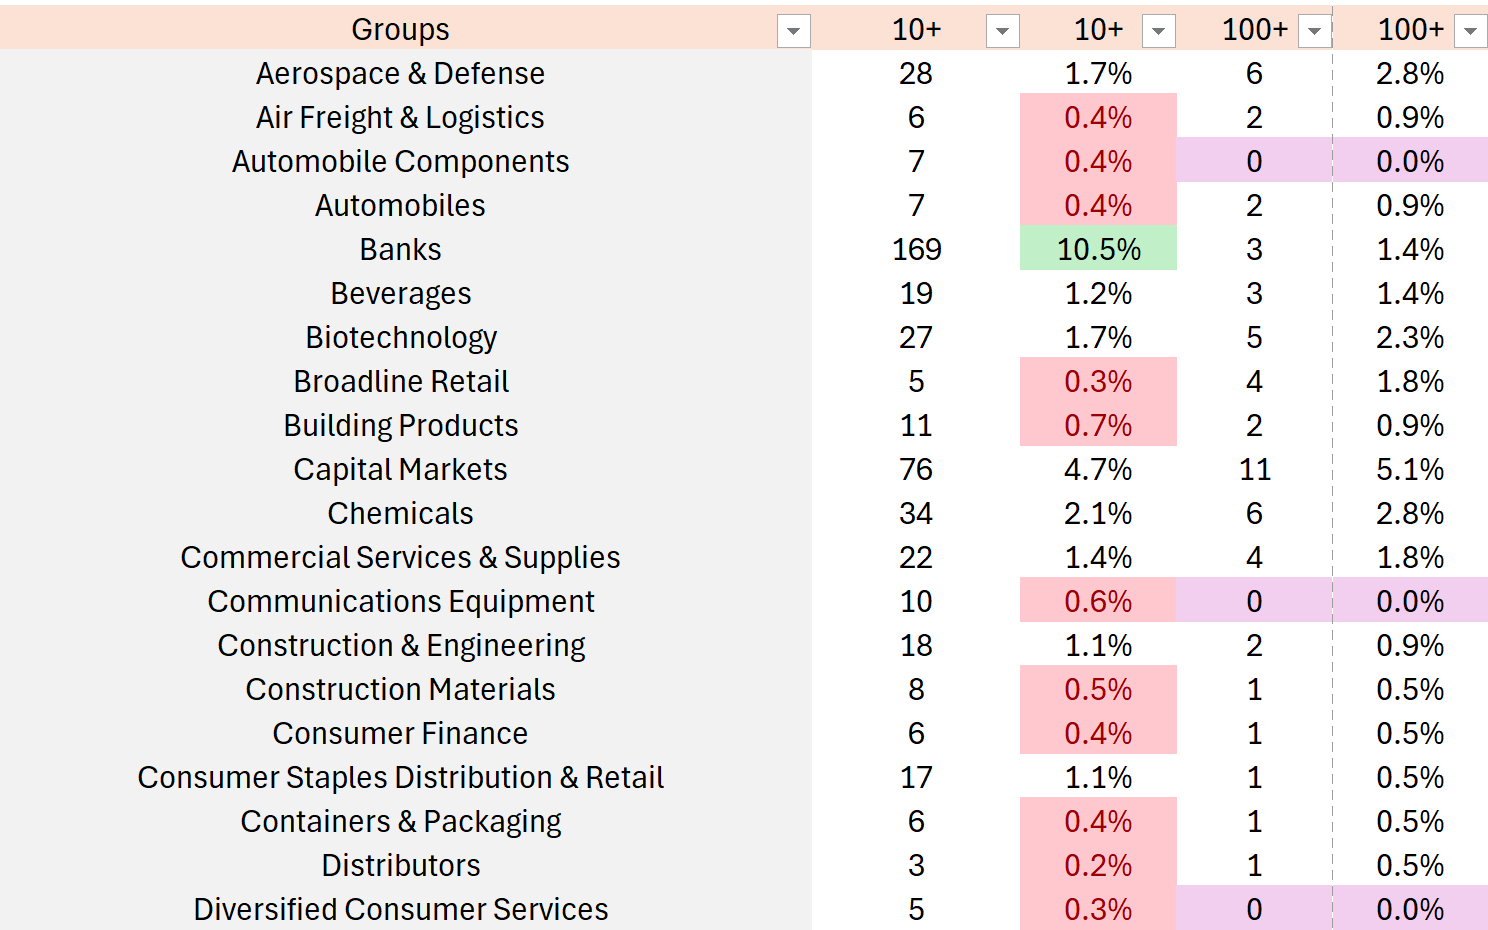
In red, the industries below 1%
In purple, the industries that did not yield any 100 Baggers
And the banks are the dominant industry in green
You can download the full PDF here because the list of industries becomes long.
Notable mentions:
Banks no longer divide into separate industries, so they dominate the multibagger population
The results become less useful, as the baggers are divided across all industries. What will be useful is to see how many companies each industry held in the first place, meaning, was there a higher probability in certain industries to pick the winners
Let’s go one last level deeper ⬇️
Level 4: By sub industry
Finally, we have 88 subindustries that have generated at least 1 100-Bagger. But some of them stand out.
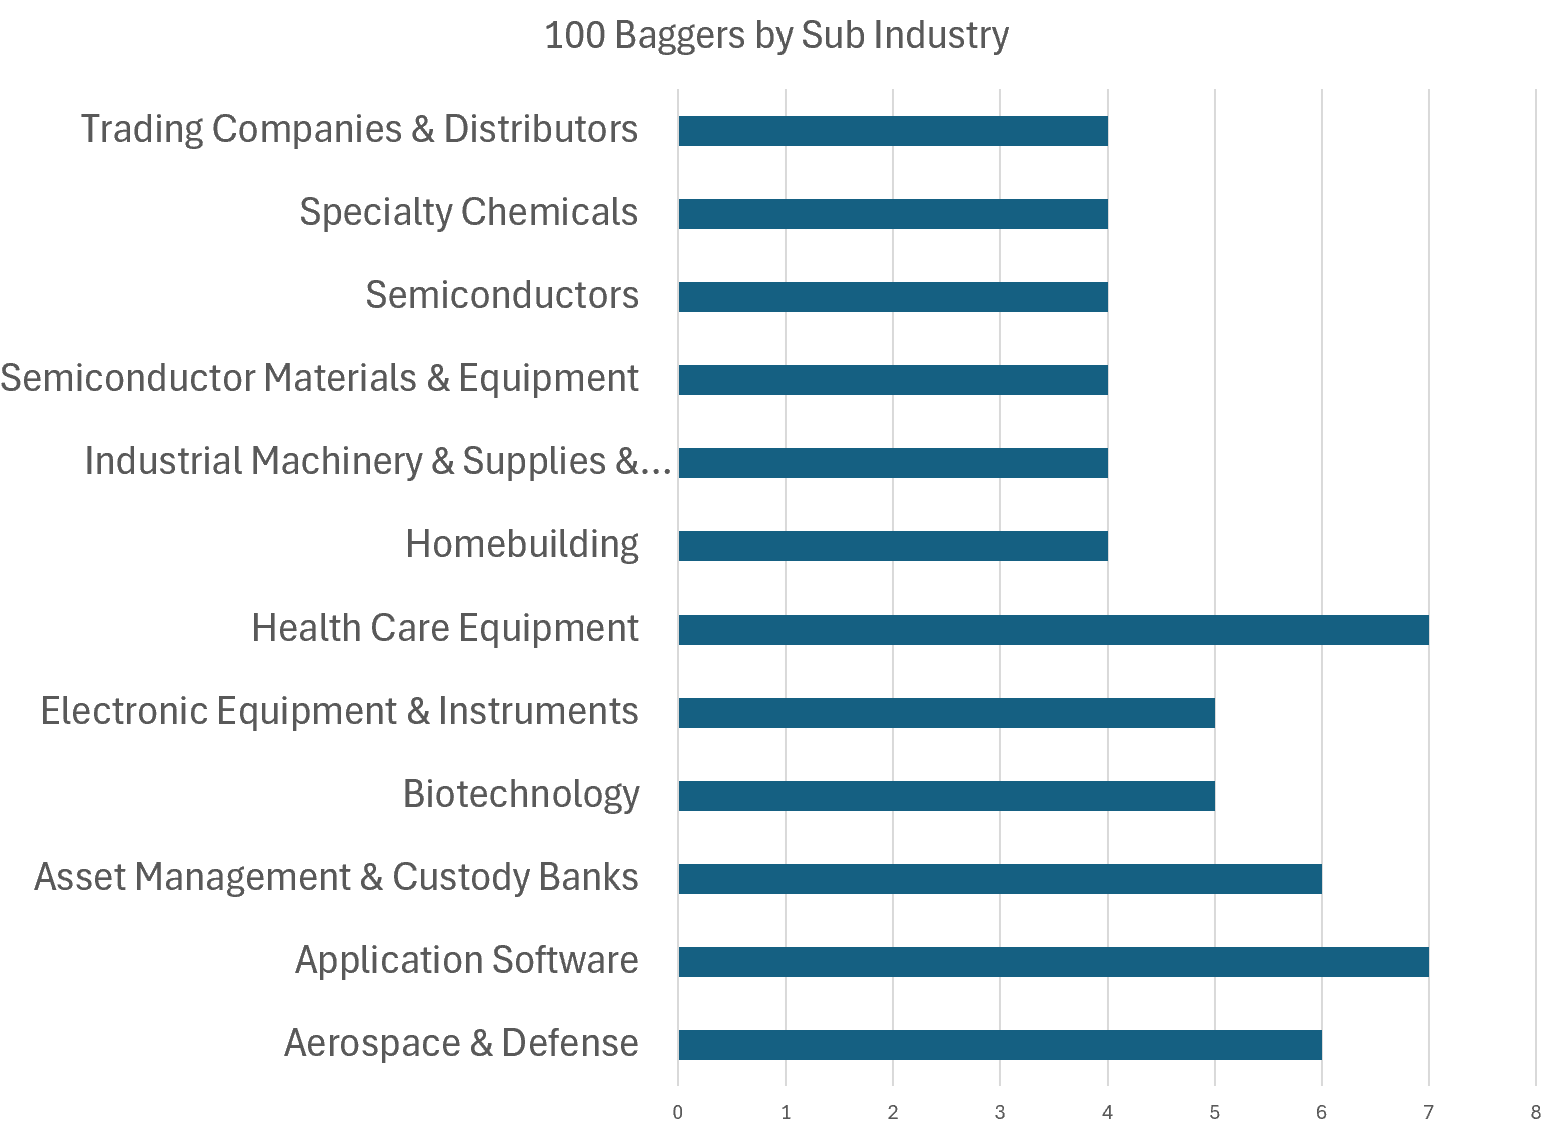
We’re not going to compare further with the multibaggers as the number of industries becomes too big. We can’t draw any meaningful conclusions from that analysis.
Conclusions
I’m afraid this first chapter leads to more questions than answers.
100 Baggers seemed to have gained speed compared to previous studies
In 30 years, more than 1600 multibaggers have surfaced in the US
Industrials, Financials, Consumer Discretionary, Health Care, and IT are the 5 big sectors that have generated the most 100 Baggers and Multibaggers
More differences appear between 10 and 100 Baggers when going deeper into the classification, with Banks appearing as one of the clear winners of the past (the GFC is included in the sample data)
But the number of industries is wide, and winners appear in all of them.
Next time, in Chapter 2, we’ll pull more on this thread and see if we can draw some conclusions on the probabilities of picking these multibaggers. We’ll also try to compare with the other cohorts.
May the markets be with you, always!
Kevin
https://www.msci.com/indexes/index-resources/gics
Both the software industry (especially big tech) and the Biotech/Pharma sector are driven by acquisitions. Small promising companies that have the potential of becoming a 100 bagger are taken over. This was not the case in the past - where internal pipelines drove business growth. As such, your study should also at least track M&A figures of the different sectors.
Excellent