
100 Software companies tested for AI resilience
Gems in the software sell-off

Last week, I showed you our framework for assessing whether a software company is prepared for the new AI era.
It’s a tool we call Hunter. You give it a framework and a list of tickers, and it will use financial data and annual reports to assess each company.
We gave Hunter a SAAS scoring framework and 100 software companies that had significant drawdowns over the past 12 months to evaluate.
This took us many days, trial and error, and iteration. You can download the full Excel at the end of this article.
Here are the steps we used:
Refining the framework
Choosing the right model
Choosing financial metrics
Let’s go.
Refining the framework
Our initial framework looked like this:
Tier 1: Survival
Does the company charge for an outcome or per seat? If per seat, the company might have a problem.
How accurate does the software need to be? If an error does not lead to a big problem, AI might displace it.
Survival is the most important aspect of the 4.
Tier 2: Defence
How many system integrations does the software control? The more integrations, the bigger its defensive position.
How big is the switching cost? How much accumulated value would a customer lose by switching?
Who are the clients? Enterprise is better than SMB, which is better than individuals
Are there network effects? If the product becomes better with more users, AI might not be a problem
Tier 3: Offence
How effectively is the company integrating AI into its own systems to strengthen its product?
Tier 4: Secondary moats that compound over time
How much proprietary data is involved? The more the better
Do legal or compliance barriers protect the business?
This is where we stopped.
We don’t want a framework that is simple but not too simple.
And we applied this to a couple of companies, like Rubrik, which gave us the following table:
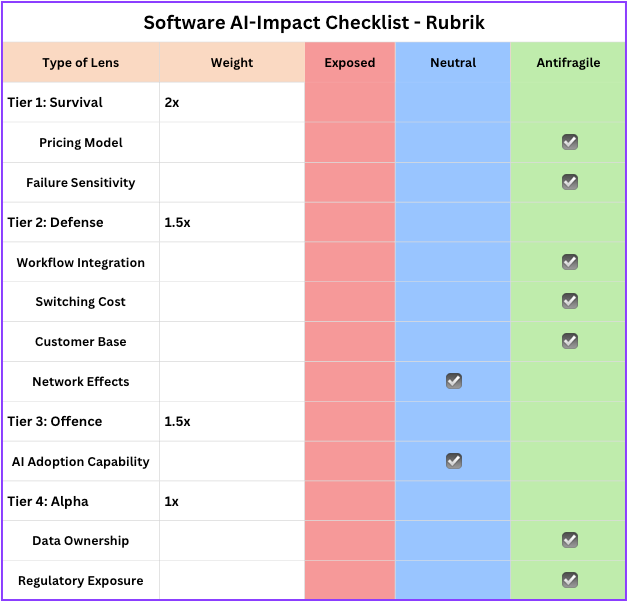
And a final score of 10.5 out of a max 13.5, which is very high.
But then one of you asked about agentic interaction with this software. If the future is agentic, will some software companies actually benefit from the AI revolution?
So we changed the framework and added this to Tier 3:
Is this company’s product likely to be called by autonomous AI agents at scale?
In other words, we try to look into the future. The strongest companies will provide infrastructure for the agentic era.
Choosing the right model
So we have a framework and a scoring system.
We need an LLM to evaluate the information we provide about the company (from the annual and quarterly reports) and return a score.
So we used Claude Sonnet 4.6 and Opus 4.6, with and without thinking mode, to see which would provide the best result.
For ServiceNow (NOW), we got the following results:
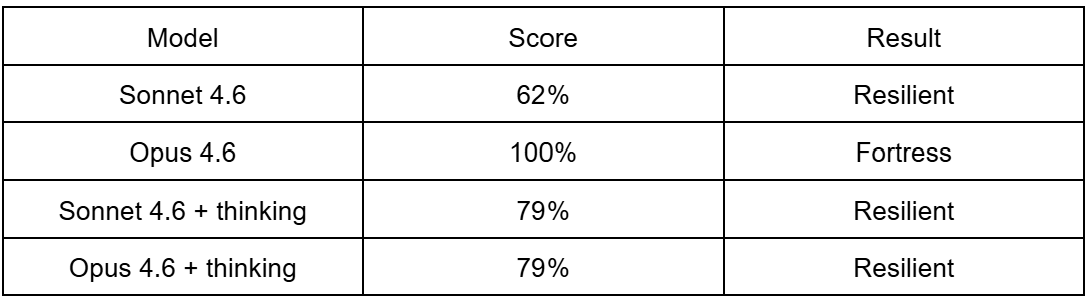
So first off, ServiceNow scores high. But the scoring is off if you don’t apply the reasoning mode to the model, which makes sense.
In our analysis, although Opus 4.6 can capture much more nuance, it made the scoring very bullish (with a 100% perfect score).
After evaluating about 10 companies, we decided that Sonnet 4.6 with the thinking mode would be the best model from both performance and cost perspectives. (Sonnet is 5x cheaper but seems to be more grounded in facts)
The scoring system
Just a quick recall of the scoring system used.
For each statement, it will say:
Anti-fragile = +1
Neutral = 0
Exposed = -1
And we’ve assigned weights to the different parts of the framework:
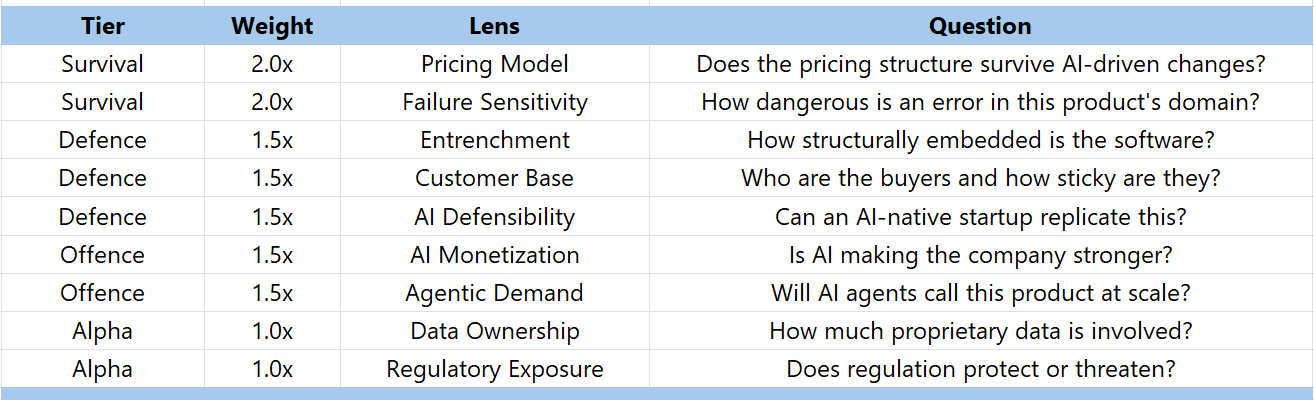
So the perfect company would score 13.5 points or 100%.
Based on this model, here’s what the different ranges will be for the companies:
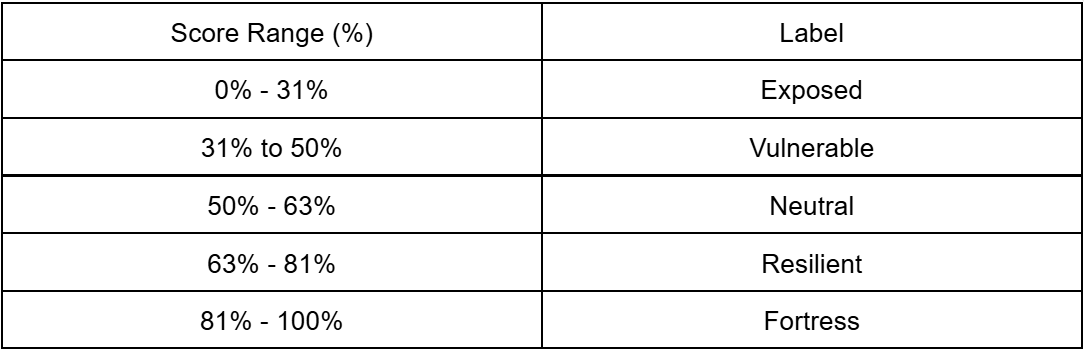
So we can aim for the resilient, fortress companies in the bunch.
We can debate this framework. What matters is the assessment and reasoning Hunter will deliver. That will allow us to draw our own conclusions.
Financial metrics
But a resilient score on itself means nothing.
If a company is classified as Fortress, but still commands a high price in the market, it might still be a bad investment.
So we add specific SaaS metrics alongside each company’s overall AI resilience score. This would give us a better picture.
We added different metrics, but some of them in particular:
Gross margins
Rule of 40
Rule of 40 (Stock-Based Compensation (SBC) corrected)
Price / Free Cash Flow
Price / (FCF - SBC)
Revenue growth
Maybe some metrics are missing. We tried not to put too much in. Which do you think we should add?
The challenger
You might have heard of the council model by Andrej Karpathy. You let different models do an analysis and then compare them, or let them debate their own results.
The final result is higher quality output and fewer hallucinations. We didn’t build a full council model.
We added an additional challenge layer to Hunter. The challenger has only one goal: to poke holes in Hunter’s assessment of a company. And a brief text analysis will be included in the final output.
You could see it as a form of reliability of the final output. Now, in the end result, the challenger will give the following output:
Agree: Only minor challenges with the assessment
Challenged: Some challenges
Very Challenged: Significant challenges
You can see it as a form of reliability.
But no company has scored “Very Challenged” in the final output. The reason is that the Sonnet in thinking mode is already very conservative in its assessments.
The result
Now let me show you the detailed output on a company like Adobe.
Adobe trades at around 240 USD today, down from its previous 634 USD peak almost 2 years ago.
Here’s what Hunter gives us:
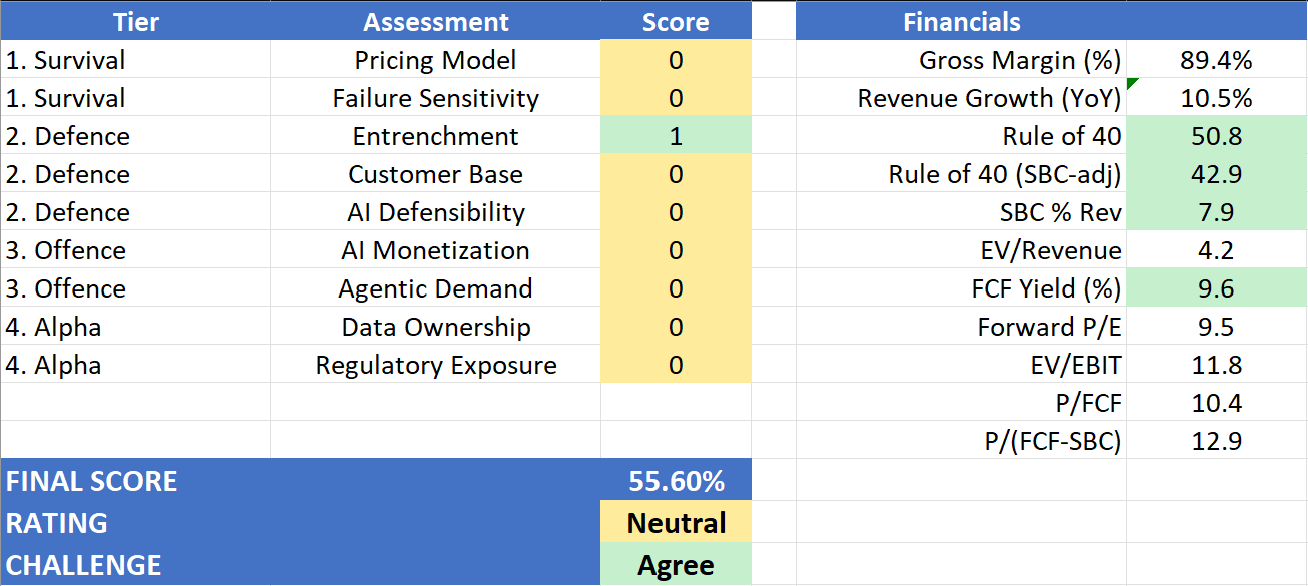
The financials look great. But it also shows that Adobe is not in a bad spot, but not in a great spot either. He ranks it as neutral.
Here’s how it did the analysis. I highlighted the most important parts in bold.
Adobe is a $23.8 billion revenue software incumbent occupying a structurally privileged position across the content lifecycle — from creative production through marketing orchestration — with 96% subscription revenue, $25.2 billion in ARR, and 40% FCF margins that reflect genuine pricing power and low marginal delivery costs. Its core strength against AI disruption lies in entrenchment: the Creative Cloud and Adobe Experience Platform function as workflow backbones across enterprise content operations, with years of accumulated assets, configurations, partner ecosystems, and multi-year contracts creating migration friction that is costly and operationally risky to overcome. Adobe’s second genuine strength is its early positioning as agentic infrastructure — the Adobe Experience Platform Agent Orchestrator, Firefly Services APIs, and Brand Concierge represent deliberate architecture for machine-to-machine consumption, not retrofitted marketing. Every autonomous marketing agent that an enterprise deploys is a plausible Firefly Services or AEP API consumer. However, Adobe faces two significant vulnerabilities. First, its pricing model remains primarily seat-based, and while the shift to consumption-based Firefly credits and API services is underway, the transition is incomplete and not yet quantified in revenue terms — the company discloses no AI-specific ARR, making the monetisation thesis harder to verify. Second, the competitive threat from AI-native entrants is not theoretical: Adobe’s own filing explicitly names AI-native companies attacking creative tools, document productivity, and marketing automation, and acknowledges ‘limited barriers to entry’ in these markets. The commercially safe Firefly training corpus and IP indemnification are genuine defensive assets, but they are not impenetrable.
Overall verdict: Adobe is a well-positioned incumbent with real structural advantages in entrenchment and agentic infrastructure, but one that faces credible AI-native competition and has not yet demonstrated the quantified AI revenue impact that would make its offense fully antifragile. It is defensible, not dominant.
What do you think of this analysis?
I personally think it’s a good assessment of Adobe’s current situation.
But the power of Hunter is not to run it on a single company.
The power is to run it on hundreds of companies, and then rank them.
So we looked at 95 software companies that had significant drawdowns over the past year and ran our Hunter through them.
Comparing the companies
That means you now have a list you can use to compare every company. If we select 1 company from each category, it looks like this:
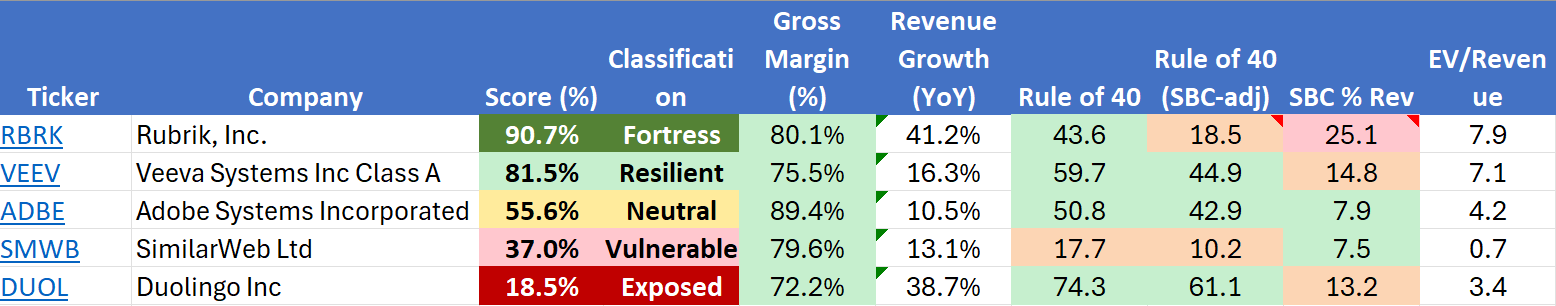
Not all financial metrics are shown here, but you can see, for each company, the rule of 40, and even that rule is corrected for Stock-Based Compensation.
Rubrik, for example, is a fast-growing company classified as Fortress-level, but its SBC weighs on its market pricing.
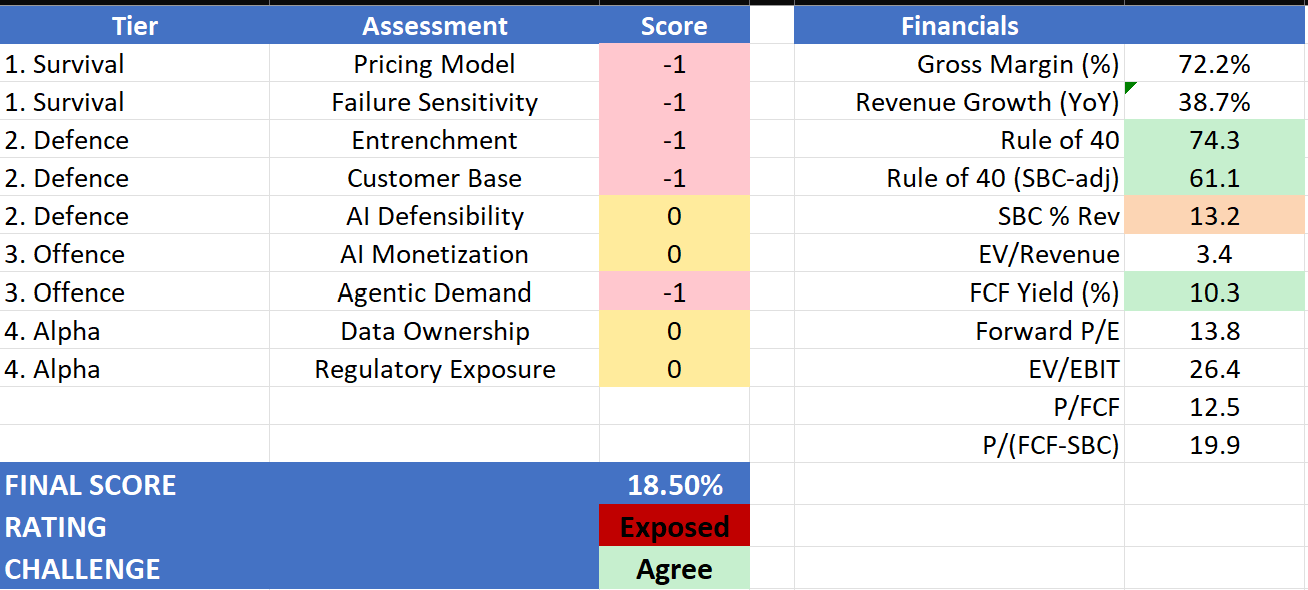
Duolingo, on the other hand, is at the bottom of the list of the 95 companies. It is considered completely exposed.
And I think the model is right:
Does that mean Duolingo is a bad investment?
Not necessarily.
How to use this data?
Our goal was to build a tool that leverages an LLM to analyze companies’ financial and textual data and score software companies.
And as you’ve seen in our framework, a SaaS enterprise company will always score higher than a B2C company like Duolingo.
But the model does not account for Daily Active Users growth, ARR, or other typical SaaS metrics.
Hunter provides an additional starting point for a company analysis. It provides a more informed list than your typical stock screener.
It is not the end result.
In future articles, we’ll go deeper into some of these companies.
The sweet spot is to look for resilient companies that have experienced significant drawdowns and trade at lower multiples, yet still offer ample growth prospects.
Those are the companies that the market might have thrown out and shouldn’t have.
We’ll write about some of them in the future.
Oh, and before I forget, you can download the Excel file:
Next steps
Hunter is only the first iteration of what we’re building. You can imagine using different industry frameworks and running the same analysis on entire industries. Our final vision is that we select an industry, and Hunter will run that industry's framework across all companies in that industry and score them. (we do hope token cost will go down though 😉)
Let me know what you think.
May the markets be with you, always!
Kevin
Nice! Looking at valuation and AI-resilience, it seems ReposiTrak is scoring pretty good. Will have a look at what they do.
Good start!
Always exciting to share experiences.
On our side we’ve been running various in-house stress-test models for many years.
And the "AI-Resilience » one for some time now together with an “AI-proofness” scale.
ADBE fails (bottom decile; highly vulnerable/melting ice cube).
Below, some food for thought …
Looking at your breakdown, I wanted to respectfully push back on the final "Neutral" rating and the 55.60% score. I suspect the linear scoring might be averaging out a few existential risks.
Fyi, our forensic look at two specific pillars:
1. The Pricing Model is much more a “Fatal Veto," than a "0"
You scored the Pricing Model a "0". However, the vast majority of Adobe's ARR is tethered to human seats. Generative AI is explicitly designed to be a deflationary force on creative labor. If a marketing agency uses AI to downsize its design team by 40%, Adobe mathematically loses 40% of its core recurring revenue. Firefly consumption credits are a band-aid; they do not offset structural seat compression.
2. Failure Sensitivity is Highly Exposed (-1), not a "0"
You also scored Failure Sensitivity as a "0". In reality, creative output operates in a zero-liability environment. If an AI generates a slightly disproportionate graphic, nobody goes to jail; you just click "regenerate." Because 90% accuracy is "good enough" for digital marketing, the barrier to entry for AI challengers is practically zero, making Adobe highly vulnerable to agile startups.
The Financial Halo Bias
Your financials column highlights a Forward P/E of 9.5 and a massive FCF Yield of 9.6%. It is crucial not to confuse a cheap stock with an AI-resilient business. The market has priced Adobe this low because it recognizes the "SaaSpocalypse" threat. It might be an excellent deep-value trade at these levels, but fundamentally, its business model is fighting gravity.
Hope it helps