
📊5 investing tools and the dangers of bad data quality
Putting my money where my mouth is

I’ve used many different software tools over the last 10 years. In this article, I’d like to present my favorite ones, particularly HOW and WHY I use them. I’ll mention what I believe could be a hidden feature for each tool that you might not know about. We’ll also talk about the dangers of using these tools.
Disclaimer: I have no affiliation with any of these software tools, these are not affiliate links. I’ll mention if I pay for them or not in full transparency. Here are the tools that will be covered:
Finchat
Gurufocus
Uncle Stock
Yahoo Finance
Simply Wall Street
There’s no Bloomberg Terminal in this list. I’d love to use it once, to “get it out of my system”. So if you have one, and you’d be open to a visitor, just let me know! 😀
Before diving into the different tools, a brief overview of the impact of bad data quality and the financial data industry.
Data Quality Shenanigans
Data vendors can sell to the financial industry (B2B), to retail customers (B2C), or both. Getting the historical data from past financial statements, cleaning them up, and making sure there are no inconsistencies takes a lot of time (read: money). A data provider selling to the industry (like Bloomberg) can spend these dollars to make sure they have the most accurate data. This is not feasible for a business that only sells its offering to retail investors.
Here's a specific example of Morningstar which sells to both the financial industry and retail.
In March 2023, Morningstar had about 115,000 paying retail customers which leads to a yearly revenue of about 28M USD. How much did their business solutions (B2B division) generate?
➡️1.1 Billion USD
However, the cost to validate the data remains the same. It’s not economically viable to develop a finance software tool for retail investors only and aim for 100% data accuracy.
Now that I think of it, this means the retail subscription of Morningstar might provide the highest quality in data. But I’ve never used it before.
Does anyone of you use Morningstar? Is it good/bad? Comments on the data quality?
The top 4 providers that dominate the financial industry are:

You can see that there is a hefty price tag that comes with these platforms.
Conclusion: Unless you’re using a professional provider (or maybe Morningstar), there will be errors in the data you use. Know this.
But this isn’t a problem per se.
Your software tool is a starting point, a first look into a company. You can cross-check data while you’re still discovering the company. But when you start your valuation work, you’ll have no choice but to dig into the annual reports or latest press releases, and uncover the ‘real numbers’.
Here’s an overview of some of the software programs out there and their data providers:

For each tool discussed, besides their data source, I’ll also add links or sources to the formulas or how the different tools calculate their metrics. It’s not only a difference in the source data, there are differences in the way certain metrics are computed.
The prime example of this difference is a metric like Return On Invested Capital (ROIC) which we covered in depth in the past.
Here’s the data for Dino Polska and Adyen for 3 different tools:

Knowing how profitable Adyen is, and how low their CAPEX is, an ROIC of 8% seems low. This isn’t a judgment on Finchat, I’ve seen these discrepancies on all the software used.
Never blindly copy a ratio from a tool.
This data quality analysis was based on a discussion on X with the founder of roic.ai.
Now let’s dig into the tools I use from day to day 👇
Yahoo Finance (Free)
Website: https://finance.yahoo.com/
Data provider: Capital IQ, Morningstar, Refinitiv Eikon
Formulas used: There’s no real glossary, but then again, you won’t find a lot of advanced ratios
Why do I use it?
Quick lookup of basic metrics. Snapshot of a company. Cross-checking data
It’s easy.
It’s free.
I use it often.
How do I use it?
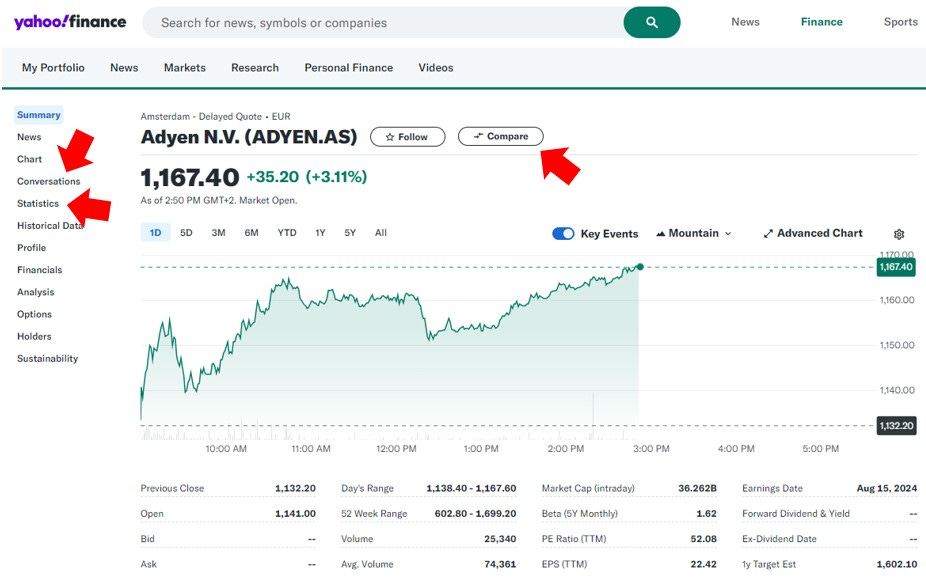
The tabs I use most often are ‘Statistics’ and ‘Conversations’. After I’ve done my valuation work, I’ll look into “conversations” to see what people are saying about the company. Are they bullish or bearish and why?
Another great feature is the “Compare” button which allows you to compare the latest financials between different companies or competitors. I like it because it’s simple.
Lastly, I’d like to talk about alerts.
Yahoo Finance as a website does not allow price alerts, but the app does. I love price alerts as I want to avoid checking the prices all the time.
Here’s a screenshot:
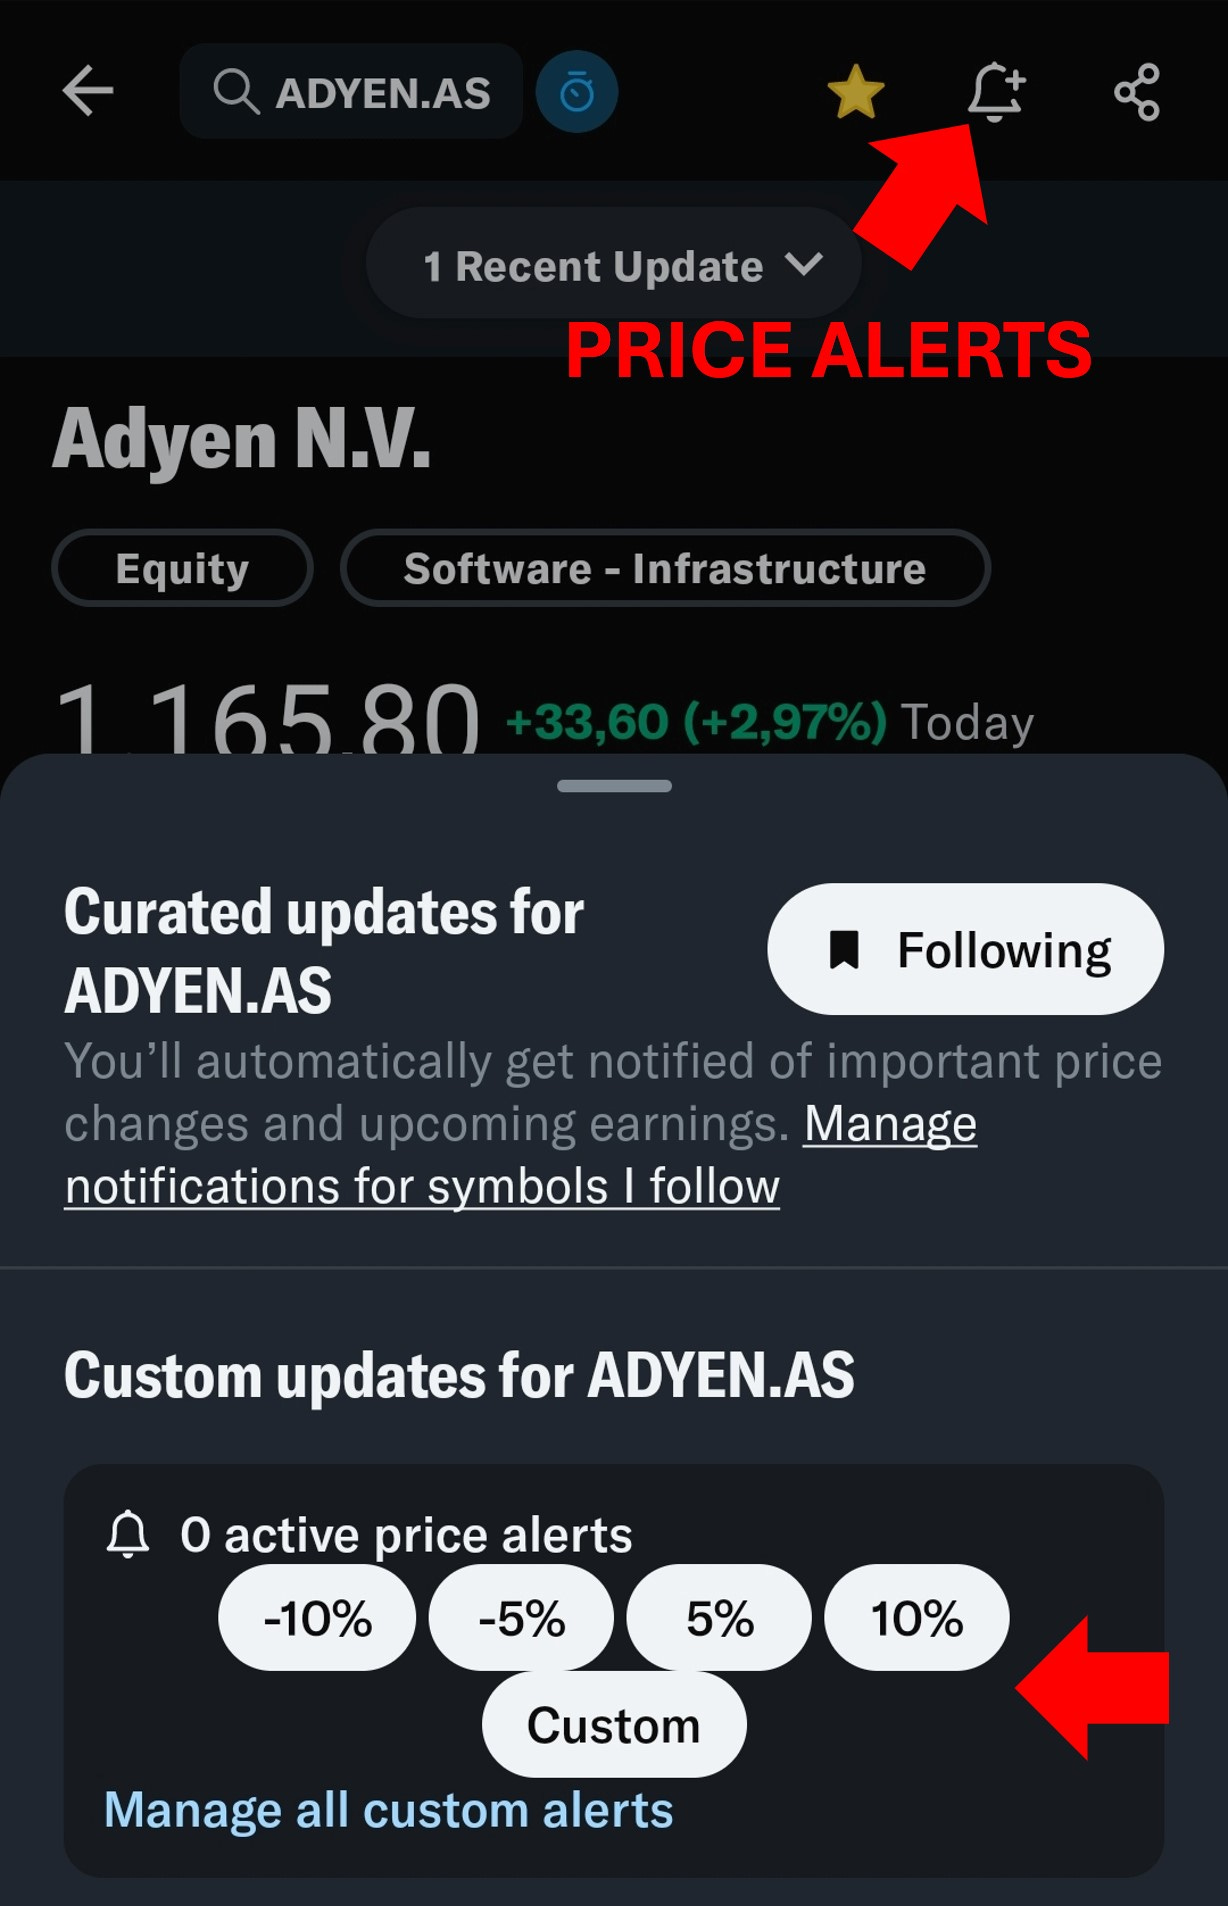
If it’s a high-quality company like Adyen, but your valuation suggests its overpriced, then you can plug in a price alert to be notified if for some reason the price has dropped to your level.
Summary
PROS ✅
FREE
Pretty good data
There’s a lot of information available on-site
CONS❓
Limited historical data
No fundamental graphs or analysis
No price alerts on their website (I don’t like using multiple apps)
Unclestock (bronze plan 120 USD/y)
Website: https://www.unclestock.com/
Data provider: EODHD, Sharadar, and FMP (Financial Modeling Prep)
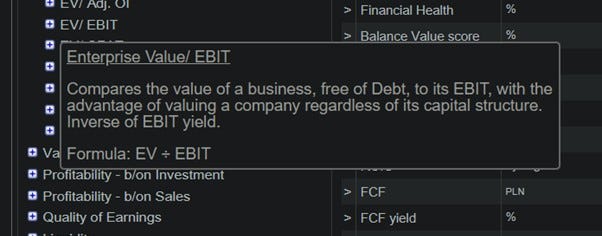
Formulas: The formulas used are found in the documentation tab. Or for any ratio, you can just hover over it, and it will prompt its definition: Here’s an example of the EV/EBIT ratio:

Why do I use it?
I mainly use it for 3 reasons:
It has a very powerful screener that covers stocks worldwide
It has financial data going back 25 to 35 years
It links to Trading View
I actually think it has the most powerful screener known to man. The reason?
It allows for metrics and ratios that you can’t find anywhere else. It has been developed by a developer/value investor. Here are some ratios you can find native within this software tool:
Owner’s earnings (OE)
Cash conversion cycle (CCC)
Cash Return on Invested Capital (CROIC)
If you’ve read my article on Buffett’s checklist ⬇️
Unclestock is the only screener I know that almost natively uses the “Buffett criteria”. (maybe Gurufocus does too, but I’ve never used the paid version).
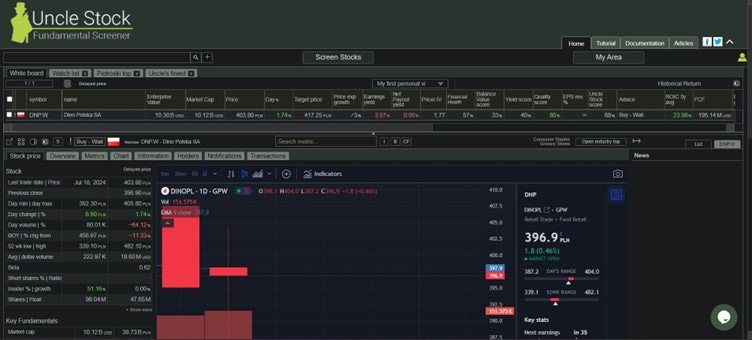
How do I use it?
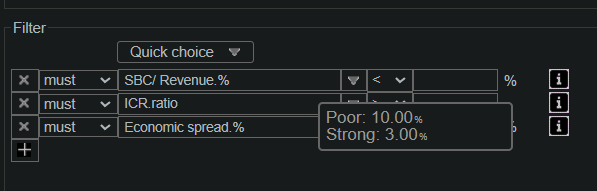
I mentioned the screener before. In the example, I picked Stock Based Compensation on revenue, Interest Coverage ratio, and the economic spread (ROIC-WACC) all baked into it. When you hover over the value you need to enter, it will even hint you what a poor and strong metric is.
Historical data: For a price of 120 USD, having historical data up to 25 and 35 years seems like a steal.
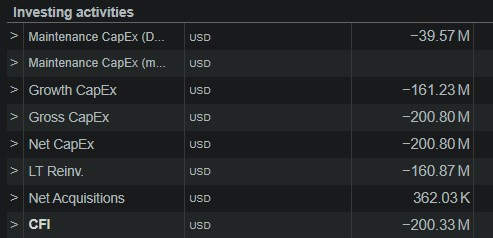
It has a great overview of the cash flow statement as Unclestock makes a proposition for the maintenance and growth Capex
It has other functionalities like portfolio construction, investing strategy backtesting (you need a silver subscription plan), etc. But I’ve never used those.
Summary
PROS ✅
Long historical dataset
Incredible array of metrics
All companies around the world
CONS❓
It is not the most user-friendly
For the savvy investor (well, I may not be all that savvy because I had to ask a lot of questions when I started using it, there is a learning curve)
Because of all the advanced metrics, you need to dig deep and figure out how they are calculated to be able to draw your conclusions
I believe there is a 14-day free trial so you can discover the tool for yourself.
Simply Wall Street (premium plan 120 USD/y)
Website: https://simplywall.st/dashboard
Data provider: S&P Global Market Intelligence
Formulas: For each tab, there is a ‘Data’ or ‘Learn’ button which has all the information
Why do I use it?
Allows for fundamental metrics on different stocks. Provides a simple screener. Some portfolio construction and watchlist capabilities. Discovery function to find new companies.
For a low price, it offers worldwide coverage.
It’s simple, it’s clean.
How do I use it?
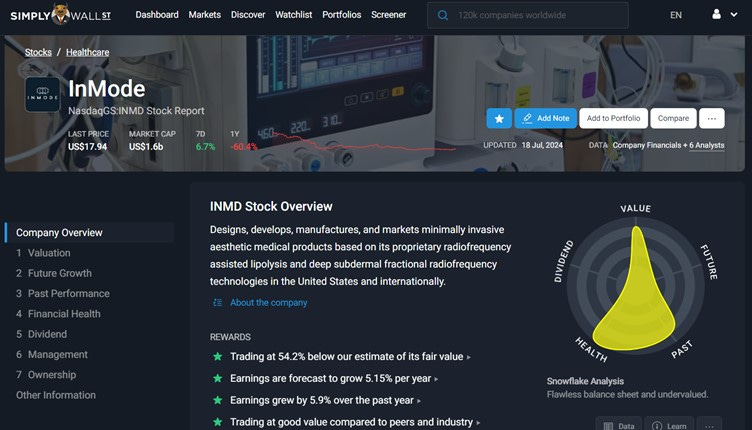
If I find a company that might interest me, I use Simply Wall Street to get a 10-second overview of the company. Thanks to the visuals, you can quickly get a first feel for the company. In the screenshot above, you can see the 7 chapters they cover.
Here’s an example of 3 features: Share price versus Intrinsic Value
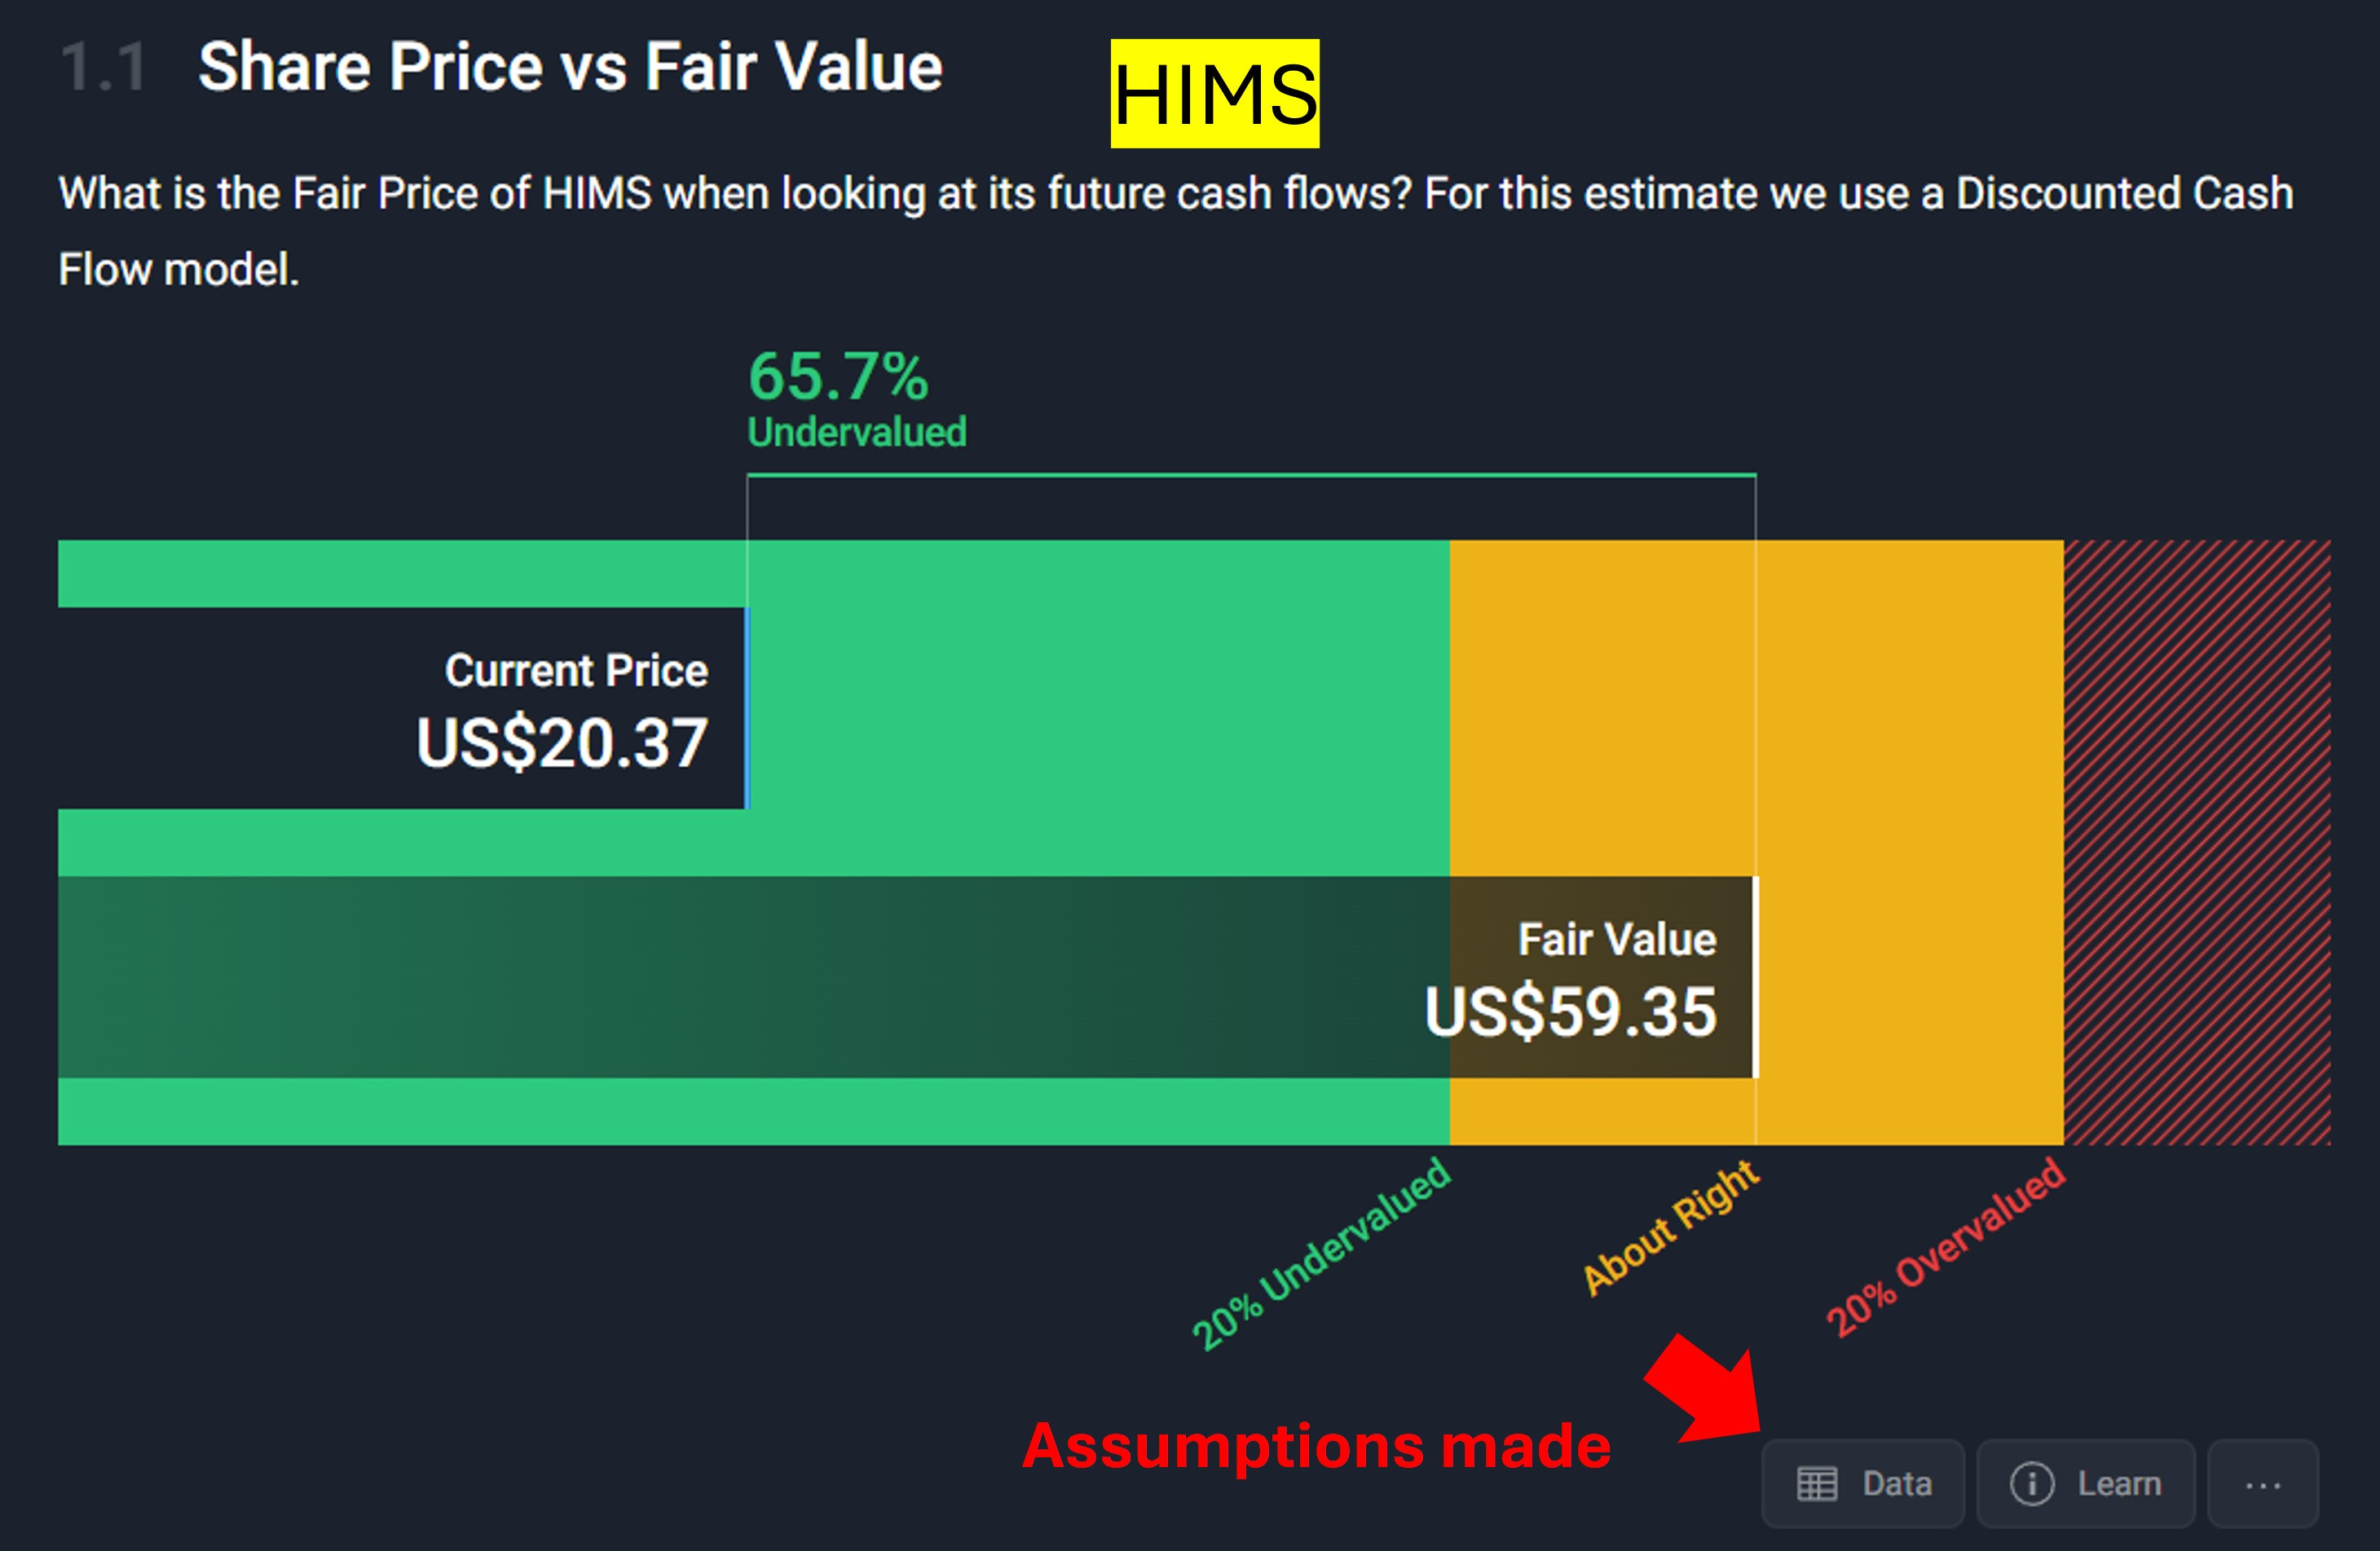
It normally uses a median of analysts’ estimates and puts it in a DCF calculation. After doing your own valuation work, you can check their assumptions with the data button. Of course, you should never take their intrinsic value as the truth. It’s automated. Always do your valuation work.
A second screen is what the analysts think the company’s future looks like.

The goal is again, to compare my own estimates to the pros.
And finally
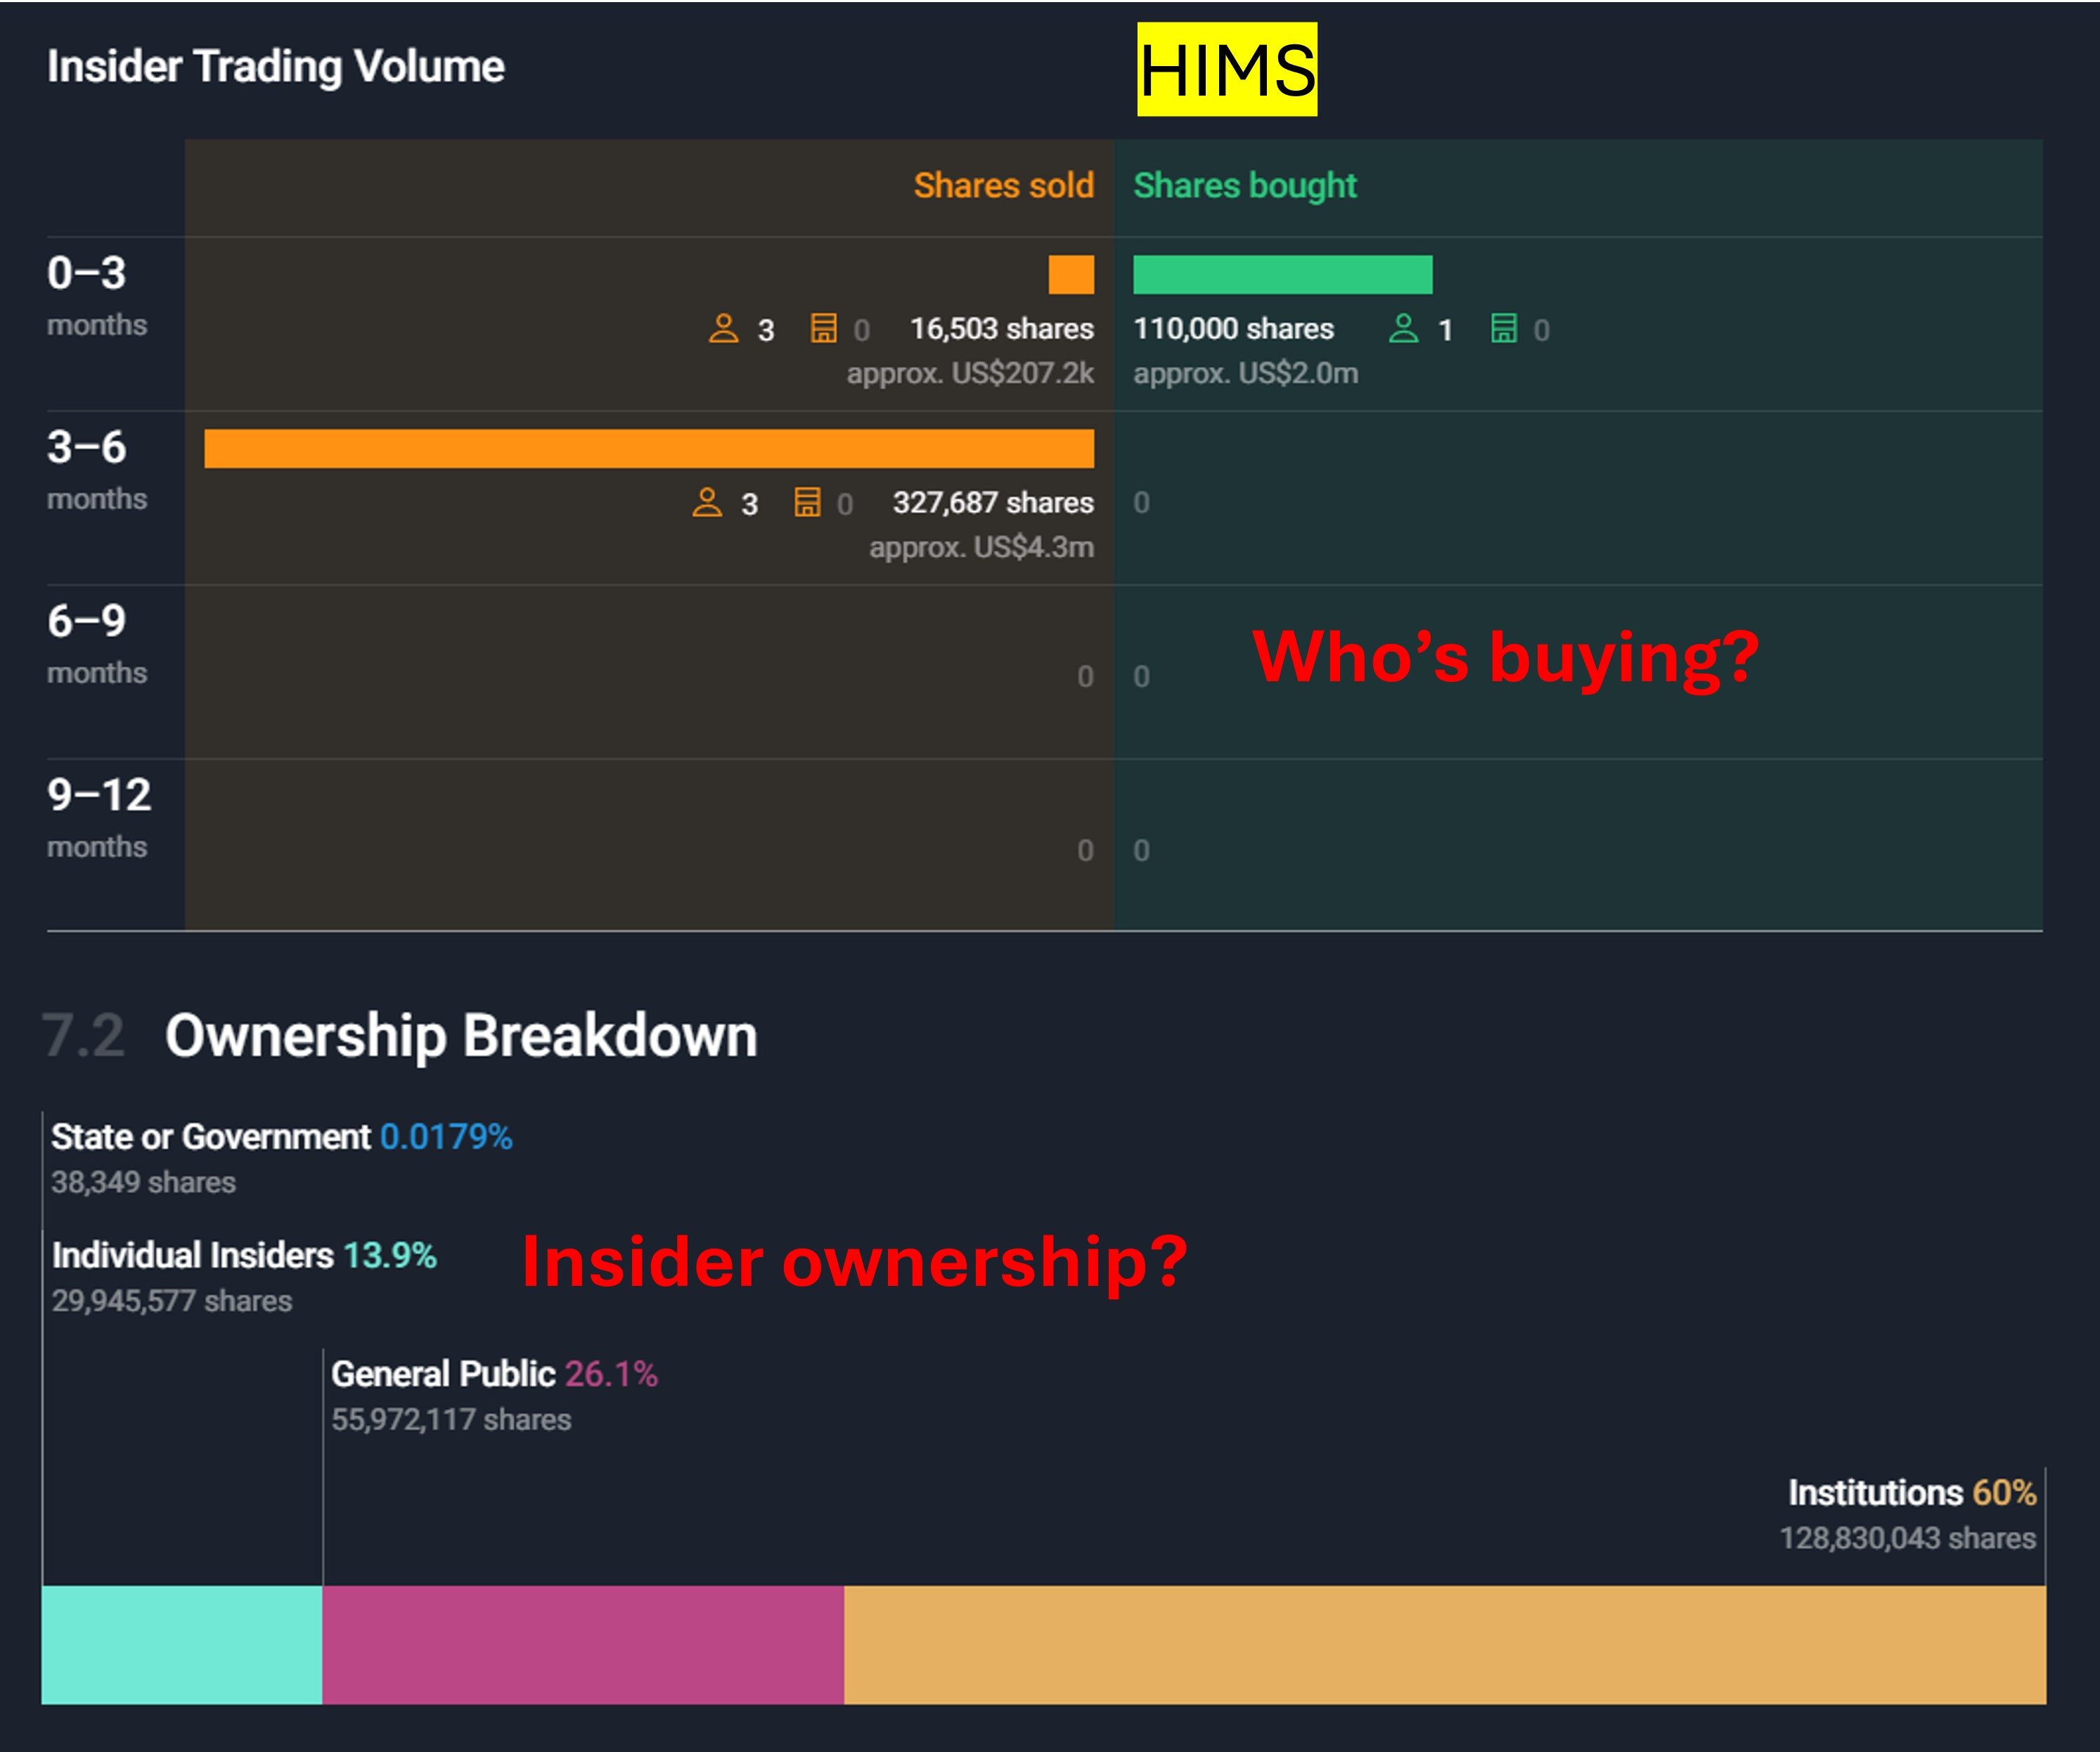
"insiders might sell their shares for any number of reasons, but they buy them for only one: they think the price will rise
-Peter Lynch
Summary
PROS ✅
The visuals (slick)
Ownership and buying /selling data
Very clean watchlist feature (+ price alerts)
CONS❓
Limited screener
The Discover function is not great
No charting analysis (but not the purpose)
Finchat (plus plan 290 USD/y)
Website: https://finchat.io/
Data sources: S&P Capital IQ, KPI and Segment data is proprietary
Formulas: You can find the complete formula glossary here
Why do I use it?
Finchat is a popular stock analysis tool that has grown its user base significantly over the last couple of years. It allows for fundamental analysis, and chatting with chatgpt while using financial data.
Finchat is becoming my go-to software to quickly look at a stock. For the more popular companies, it provides KPIs and segmentation data which also speeds up stock research. I’ll probably cancel my Simply Wall Street subscription as there is an overlap (Finchat can do more).
How do I use it?
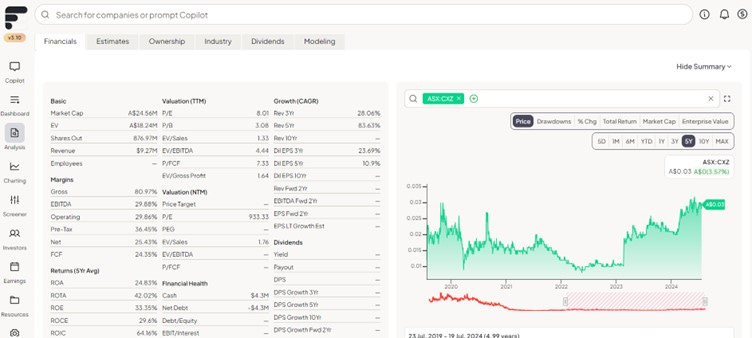
Finchat is a great modern financial tool. From creating dashboards to charting to competitive analysis. It has it all. It aims to become the only tool a retail investor needs.
There are 2 unique features to Finchat that I’d like to mention:
As the name suggests, the first one uses the power of ChatGPT combined with financial data so you can ‘talk’ to a company. It’s getting better and better and I might write an article on it on how to do advanced prompting with Finchat.
The second one is the owner’s mode. If you remember Buffett’s PetroChina investment, he read through the annual reports and figured out what it was worth. He then looked at what the stock was trading and discovered it was trading at 1/3 of his intrinsic value. So he bought it.
He did the valuation work first and only looked at the price second.
When you activate the owner’s mode in Finchat, pricing information gets blurred. Well, some of it. Here’s a screenshot:
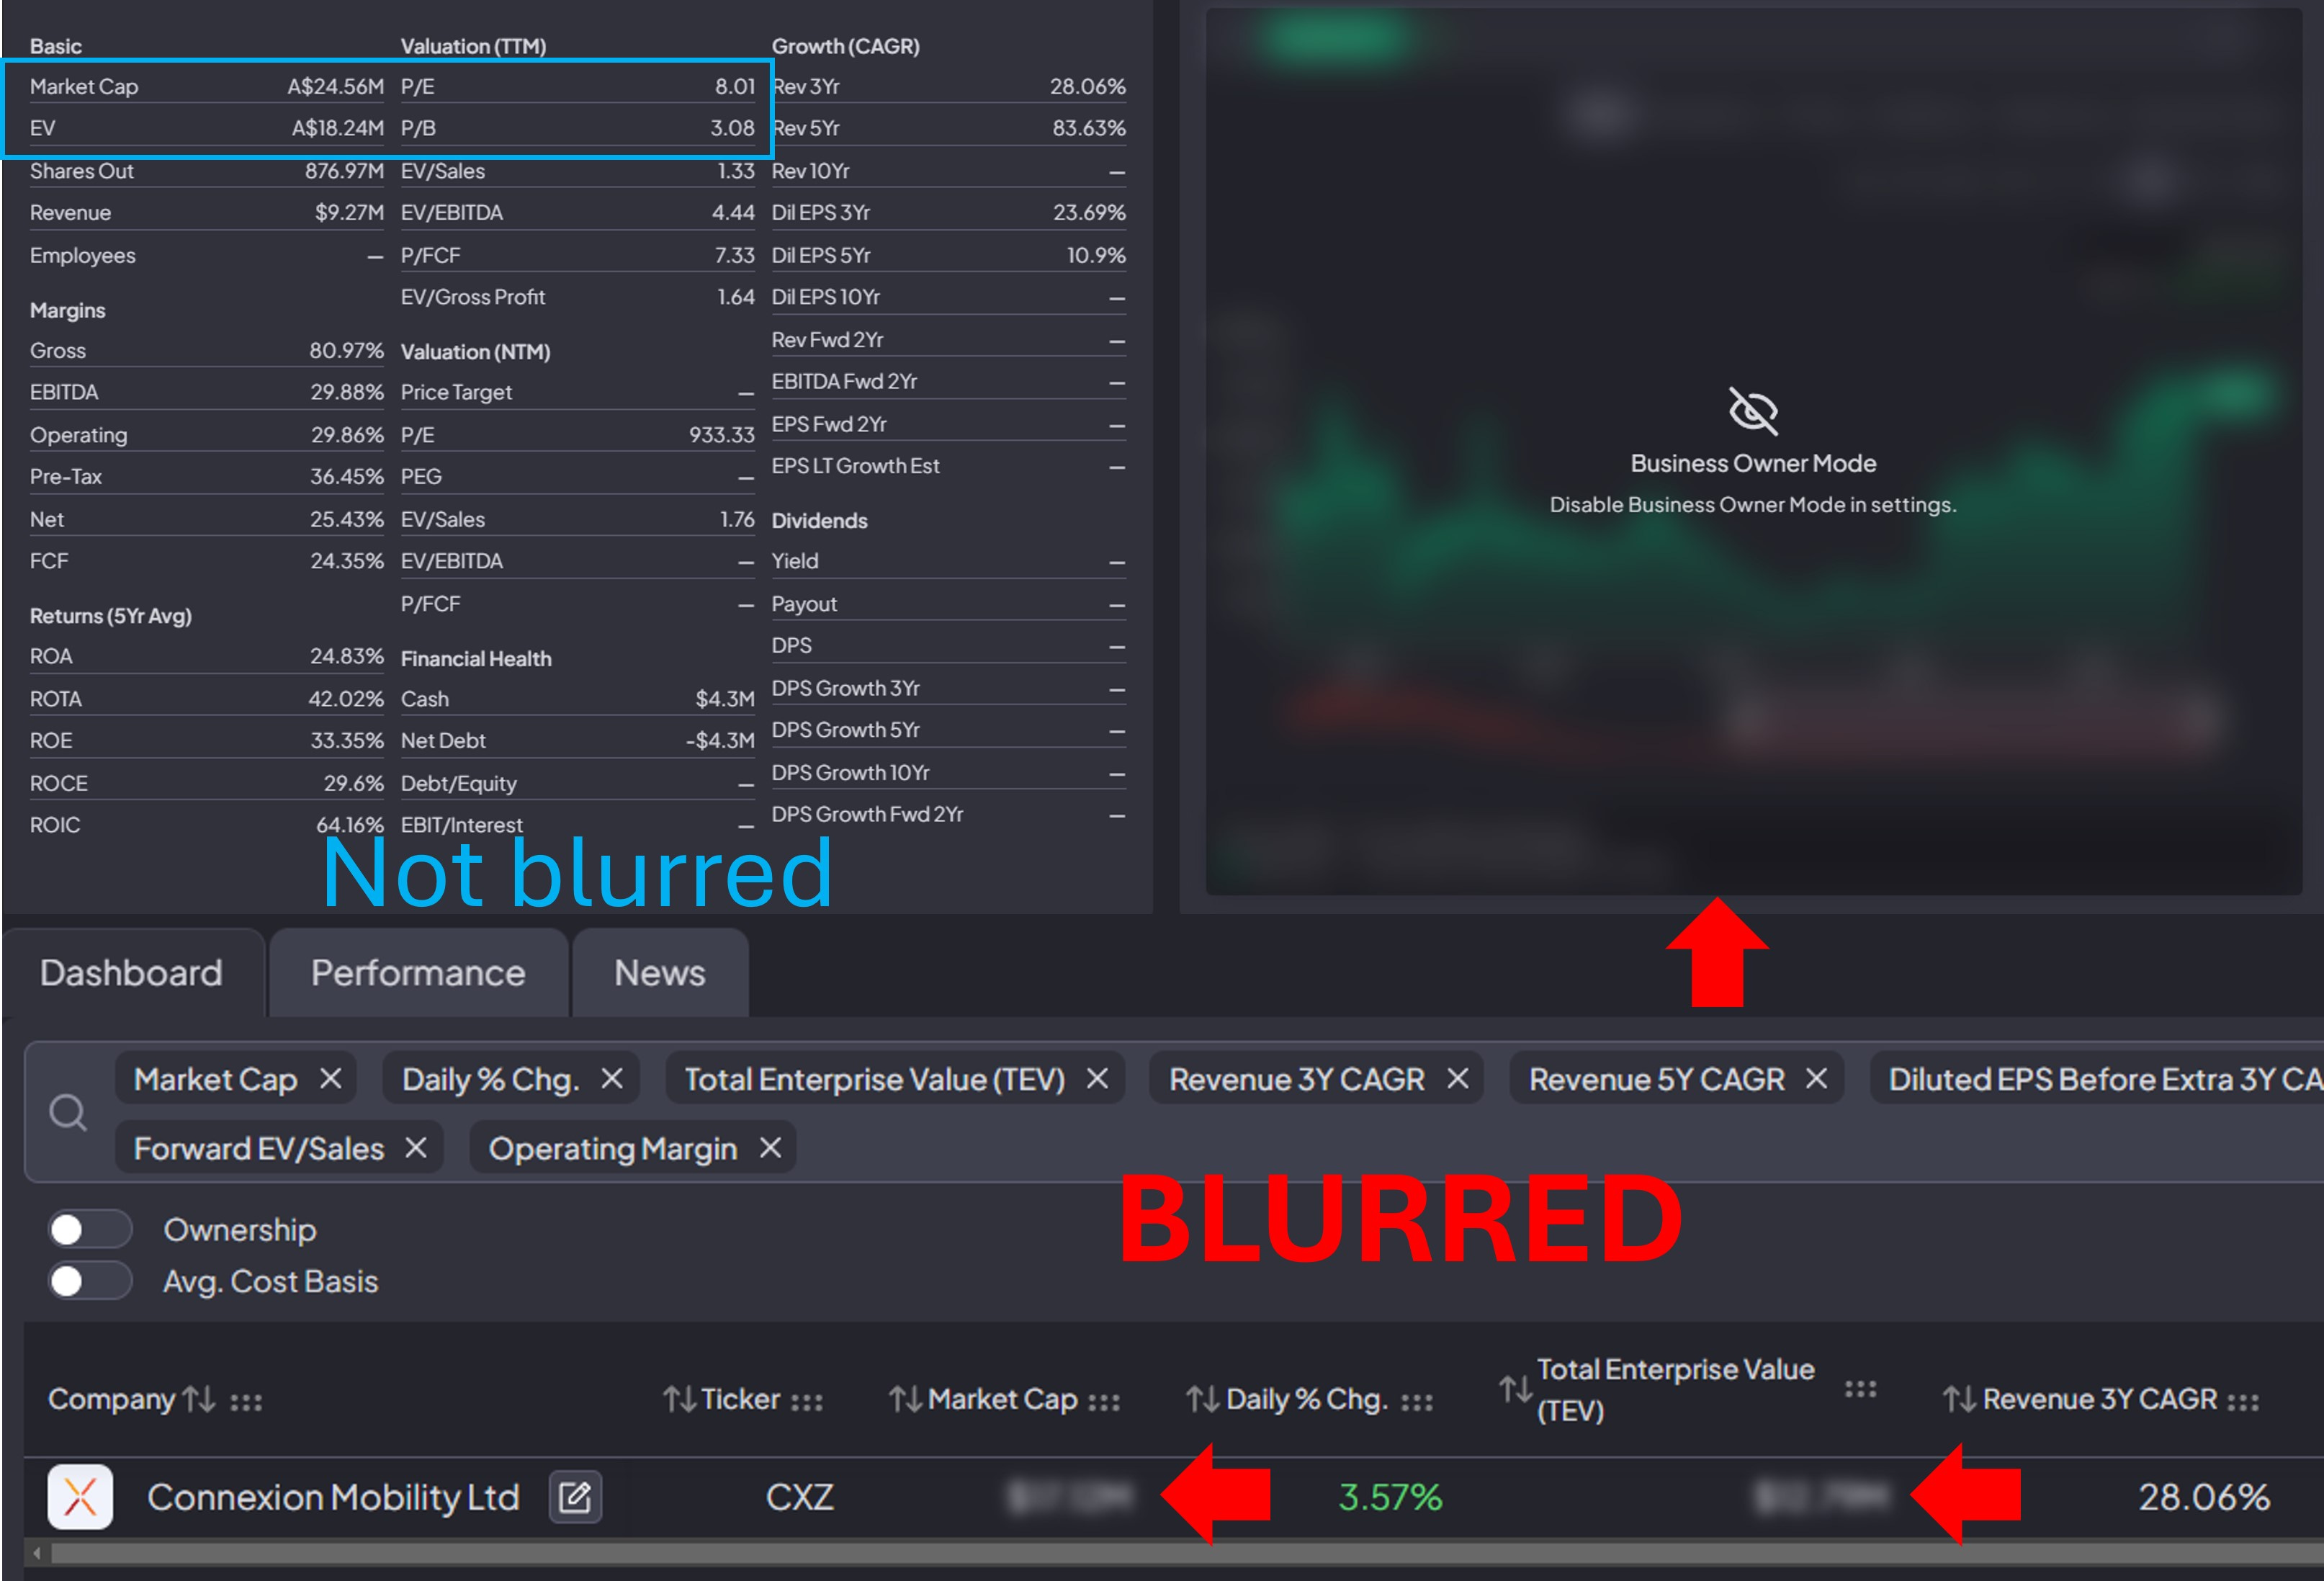
The price chart is blurred. When you look at a company in your dashboard, market cap and enterprise value are also blurred.
But nothing is blurred on the main overview. So it’s not perfect yet.
A true owner’s mode should be a mode where you feel like buying a private company. You’ve got all the data, but no clue on what the price in the market is.
That’s not an easy thing to do nowadays as price is usually the first thing you see.
Summary
PROS ✅
Modern UI
An owner’s mode
Segment data and KPIs
CONS❓ (I’m nitpicking)
No TRUE owner’s mode yet
Still experimenting to find a real benefit in Finchat/ChatGPT
Additional data is still heavily US-focused (no earnings calendar for Australian companies)
There is no trial but you can use their software for free indefinitely. (with 5 years of financial data).
Gurufocus (free version)
Website: https://www.gurufocus.com/
Data provider: Morningstar
Formulas: Click on any ratio, and it will take you to the formula gurufocus uses with examples
Why do I use it?
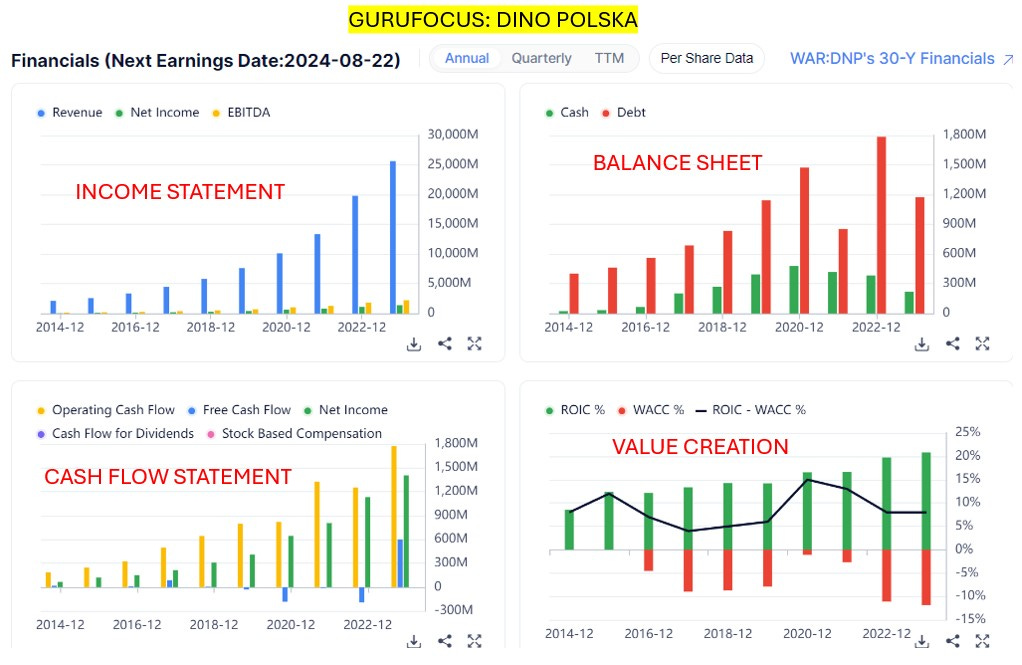
Gurufocus is a very detailed and complete platform. I use the free version from time to time to quickly look at graphs and cross-check metrics like ROIC. Its interface is less modern than Finchat but more than Unclestock. It provides 30 years of financial data, charting, a powerful screener, articles and much more.
I like it a lot, and if the paid version for a worldwide investor wouldn’t be so expensive (about 1500 USD/y for the regions I would focus on), I would probably buy it.
How do I use it?
If you look at the screenshot, it visualizes what I would do myself in Excel. I cross-check, look at specific ratios, and use all the graphs it provides. It is one of the few sites I know that shows the Peter Lynch chart:
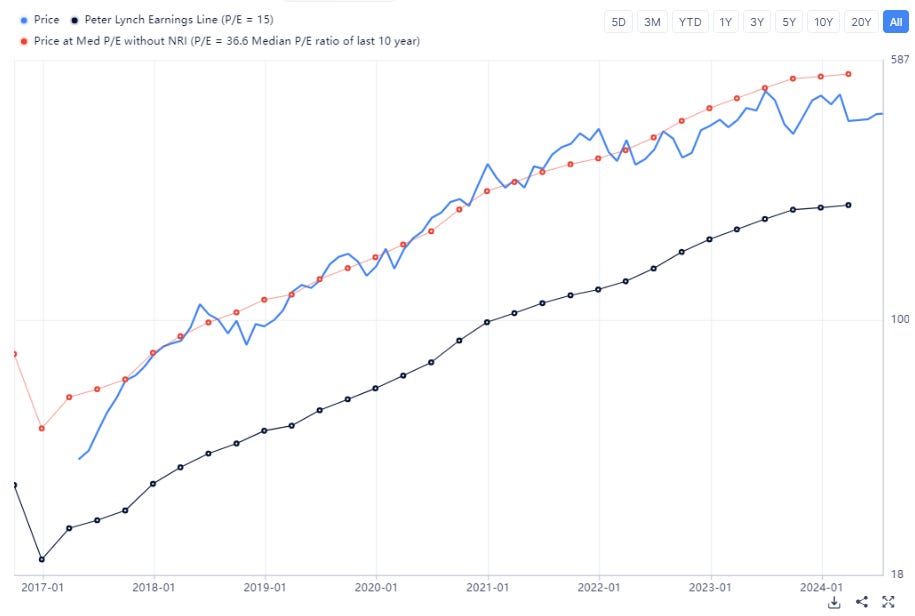
Peter, if he used the chart, wouldn’t buy Dino Polska.
It provides endless data and abilities which can be overwhelming when using it.
Summary
PROS ✅
Amount of options
The Peter Lynch Chart
Very clean charting layout
CONS❓
Can be overwhelming (a lot of data)
Price is high if you are investing worldwide
There’s a learning curve if you want to benefit from everything
Conclusion Financial software tools
All retail tools have data errors
You can cross-check data (if they use different data providers). You could cross-check data between Finchat and Unclestock or Yahoo Finance
Accept there are errors, in the end, it’s your valuation work based on the official reports that matters
Check the formulas used especially if you use ratios like ROIC
Honorable mentions
I have a paid subscription to Seekingalpha, but I don’t use it as a financial tool. I use it to browse through articles and look for the opposing view. The bear case for my bull case and vice versa. A great way is to look at the comments in the articles if you’re interested in finding a more bearish view. The problem: It’s again mainly focused on the US. You won’t find any articles on microcaps outside the US.
Substack
Well, since I started the article with, what am I actually paying for. In addition to financial tools, I also pay for a couple of substacks.
The links below provide a discount on their offering. Again, these are not affiliate links. It’s a great source for ideas and to learn about investing. You can go check my recommendations for other substacks I like.
But as they say, put your money where your mouth is. So here are 2 substacks I pay for aligned with my current investing strategy:
Compounding Quality: You probably know about this one. It provides 3 articles each week, shallow dives and full deep dives, and above all, a great investing community of like-minded people. That’s the main reason I decided to hop in.
Treasure hunting: Sebastian is a very talented microcap investor who provides investing ideas through his substack. I believe Sebastien thinks differently from others which I like. I’m pretty confident that with his ideas, and building my conviction into some of the companies, I’ll quickly have my money back from investment returns. He recently launched his paid substack. His launch offering is available until the 27th of July. Check out his performance in his post below and decide for yourself.

I honestly think you can get great value for money on substack. A 2 or 300 USD yearly subscription might seem like a lot, but if it helps you get a better performance on your portfolio, it might be the best investment you’ve ever made (besides investing in yourself of course).
Will all these tools gain you an edge in investing?
No.
The true edge lies in the temperament you have, and your relation towards volatility in the markets. But if you’re a retail investor, and you never have enough time to study that company in detail, these tools can speed up your process.
I’ll be on vacation in the north of Spain (Galicia) for the next 2 weeks. The articles will keep coming on Friday, but I might be less responsive through the emails and comments.
Don’t forget to leave a comment, I would like to know which tools you are using!
As always, may the markets be with you!
Kevin
Yahoo Finance, Simply Wall st. IBRK.
Thank you, very informative and interesting! These types of articles regarding the process itself are very informative. I mainly use TIKR because I have had a perception that TIKR has the most accurate data regarding the small stocks outside of the US and that their pricing gives the most value for money. However, I will give a try to the site you mention!