
A prime example of operational leverage
Earnings Update Robot Payment Q3 2025

Short recap
Company name: Robot Payment
Ticker: 4374
Current market cap: $69 M
Original Deep Dive ⬇️

Previous earnings update ⬇️

The company has been performing as expected, with a slight slowdown in growth, but again, by showing great operational leverage.
The multiple in the market has gone down. We discussed this in our previous earnings update that a PE of almost 32 was rich.
It has trended down, and on an EV/EBIT multiple trades at around 7.4.
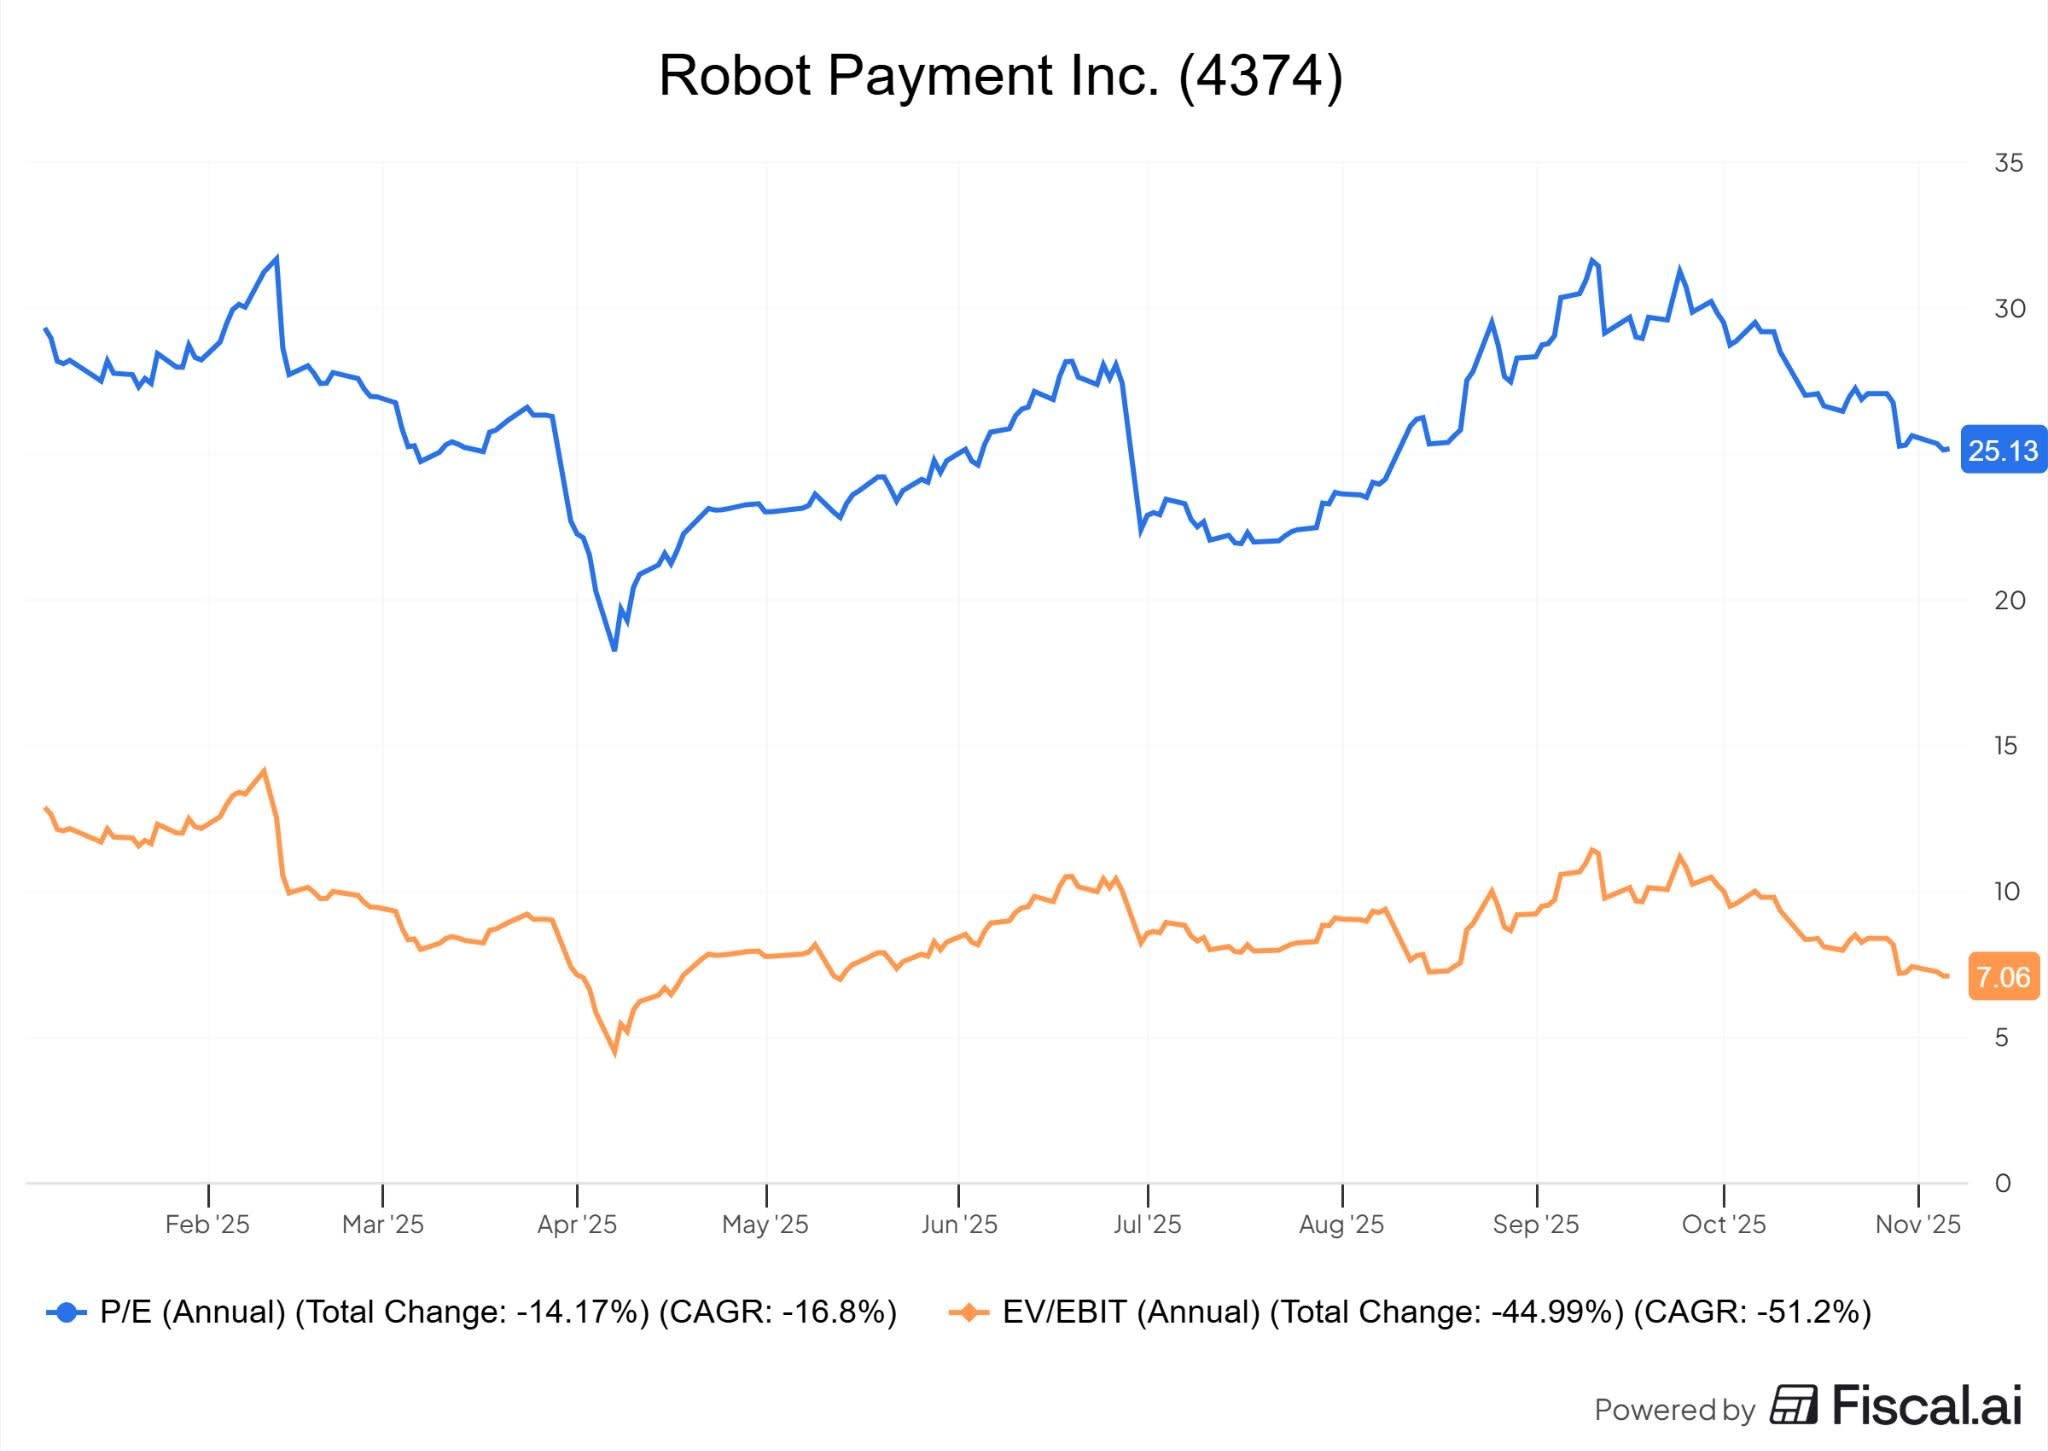
But be careful when using the enterprise value number provided by your favorite financial software.
Although this business has negative working capital, a lot of that cash on the balance sheet are temporary deposits from customers.
Let’s get deep into the weeds on what happened this last quarter and also include an update they did which was pretty rare and unusual for a japanese company.
What was in this quarter?
The good (strengthens thesis)
Top line growth remains strong (although they cannot reach the 20% growth rate at this time).
Robot delivered 18.6% yoy revenue growth and a whopping 58% operating profit growth in Q3. A slight slowdown from the 19.6 yoy growth in H1 of 2025.
And as you know by now, this company publishes monthly sales figures:
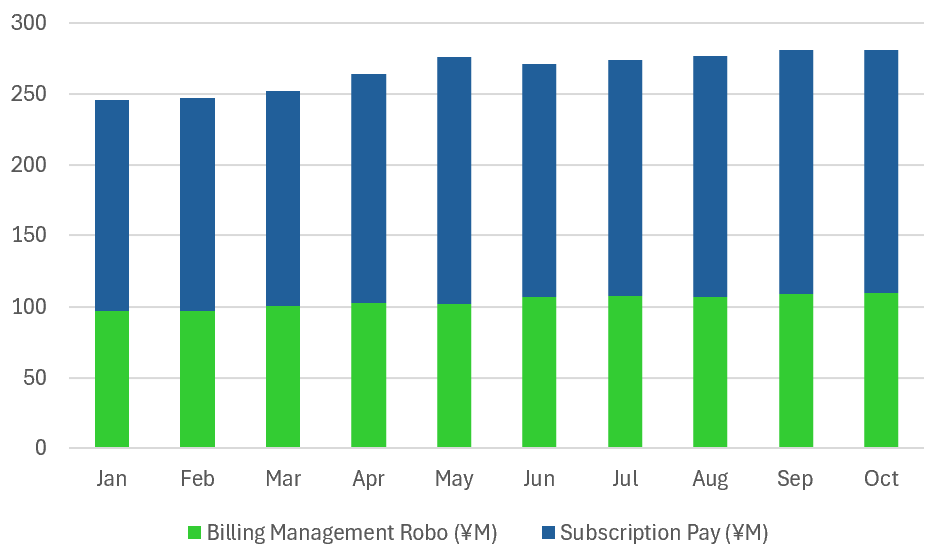
Where both segments are steadily growing.
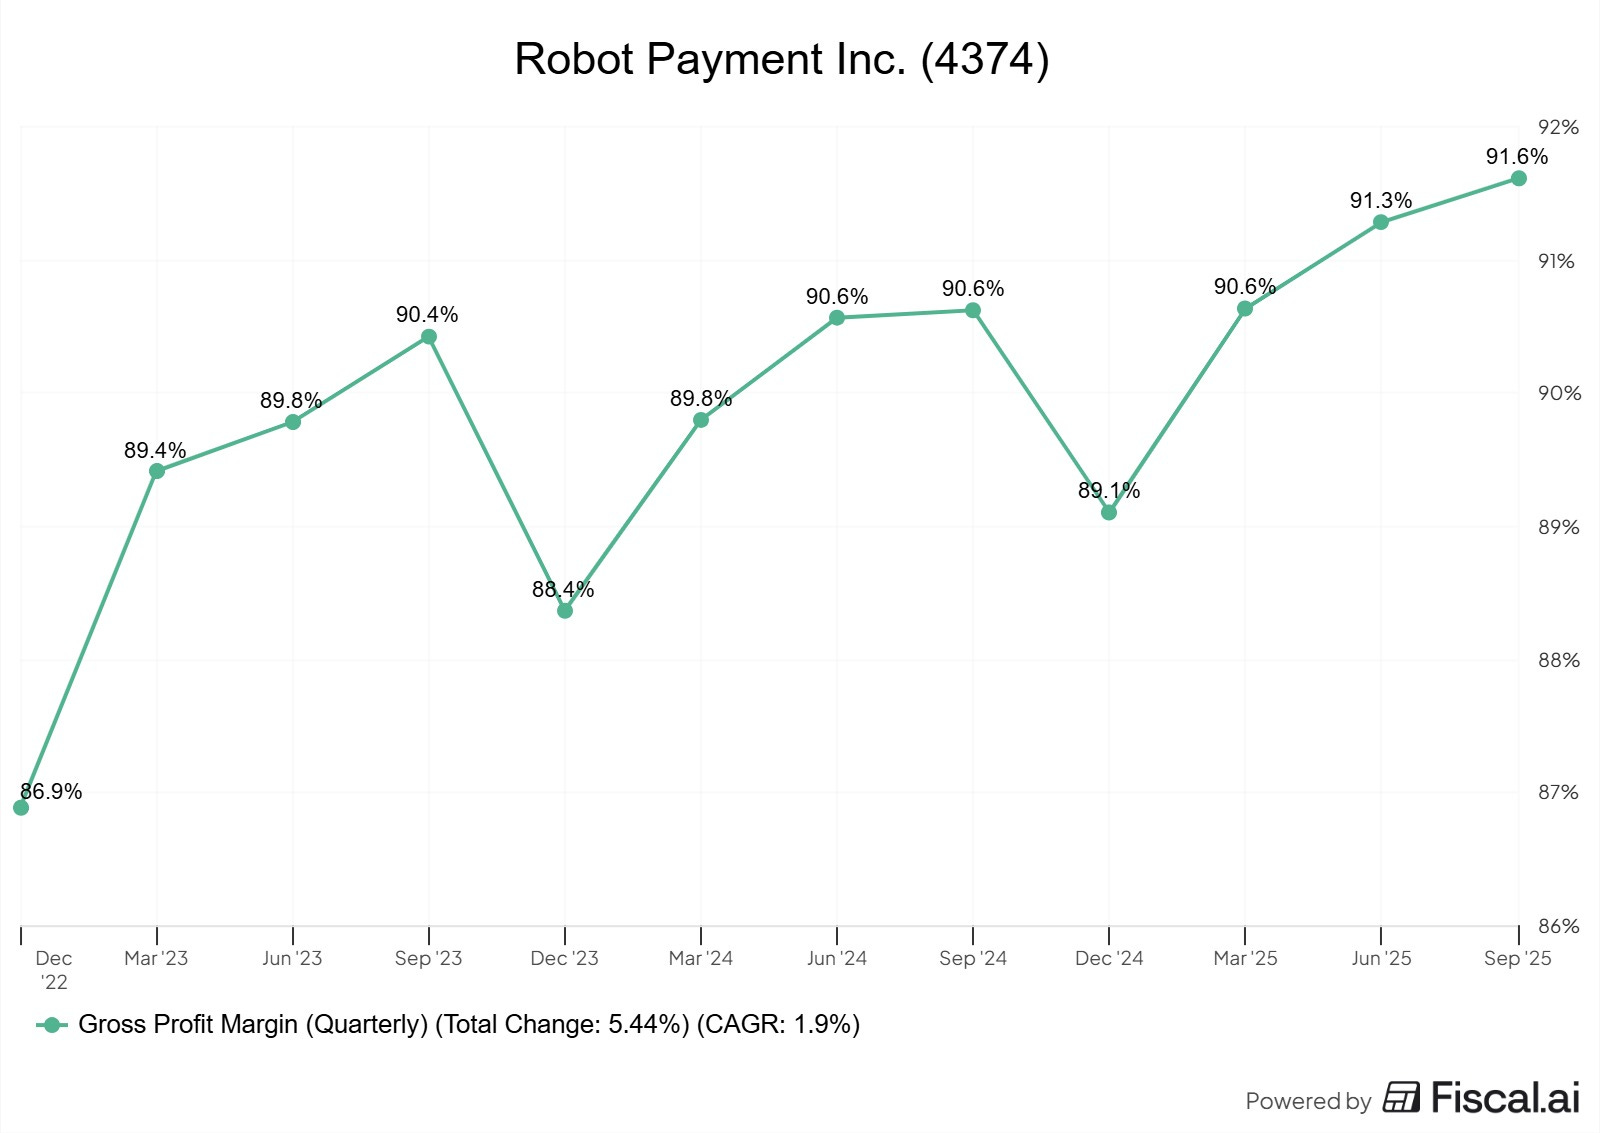
According to management, the price increase in July dropped to the numbers for the first time.
And indeed, gross margins are creeping upwards by the quarter. But as mentioned in the deep dive, expect an end-of-year slump.
This drop in Q4 is due to:
Major retail seasons = high volume = higher fees for Robot
Increased promotions by Robot at the end of year
For annual contracts, discounts and adjustments hit the cost side each year in Q4
They also, for the second time this year, increased their guidance (a bit):
Revenue: ¥3,200bn ➡️¥3,235bn (+1%)
OP: ¥685m ➡️¥700m (+2%)
Net profit: ¥447m ➡️¥477m (+7%)
They could have just not increased it, honestly.
There are 2 ways to look at this:
Marketing
Transparancy
I believe it’s a little bit of both.
Lastly, the take rate has increased from 0.76% at the start of 2024 to 0.84% in the latest quarter.
The bad (yellow flag)
Let’s look at their unit economics:
For their payment segment
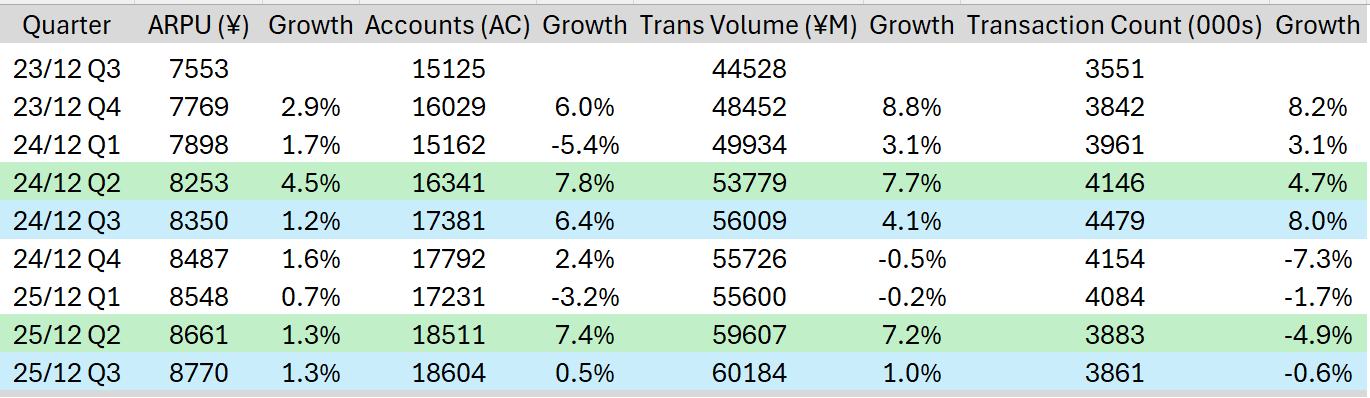
The average revenue per user looks solid. The number of accounts has grown, but less than a year ago, which explains the smaller growth in total transacted volume.
You can also see a pattern here. The reason for this is:
Japanese companies finalize budgets by March, review all the tools they use, and make sure to remove overlapping systems, renegotiate contracts, which explains the drop each year in Q1.
Small online businesses or solo entrepreneurs close or pause services around the New Year. The impact is revenue is muted, but the impact on the number of accounts is clearly visible.
So, the numbers are seasonal, growth continues, but it seems to be slowing down a little. The previous take rate growth reflects the price increase and steady ARPU expansion.
For the billing segment
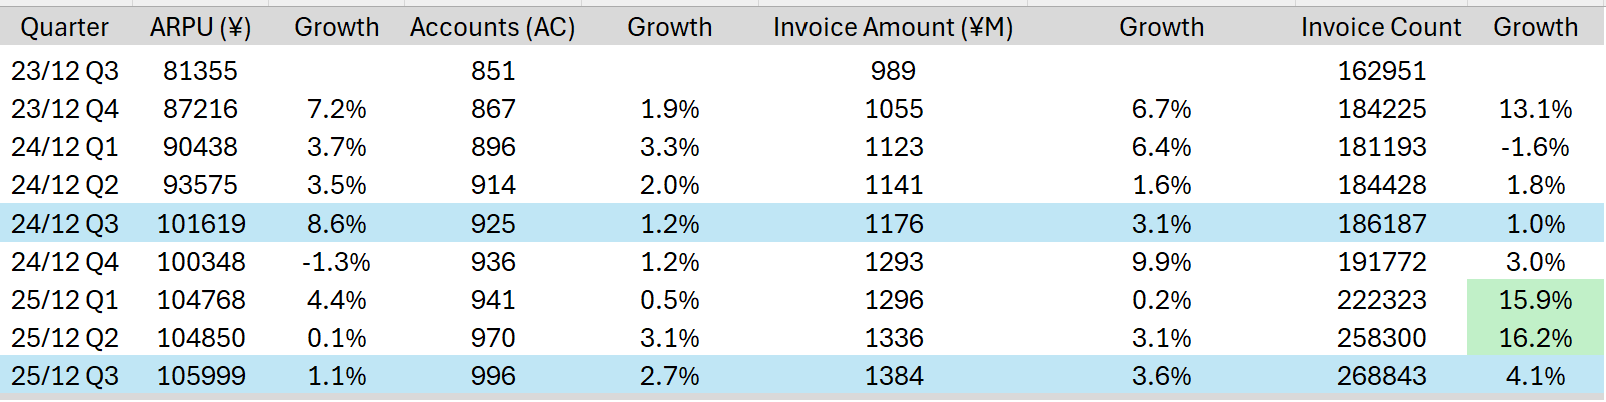
Although this year, they parsed through a lot more invoices, overall growth numbers like ARPU are down.
In other words, the payments segment is still doing good, but the billing segment’s growth has slowed down significantly.
The ugly (red flag)
There are no ugly details to report from this last quarter.
Long-Term Outlook
Before going into the details, let’s look at what they announced during their strategic long-term outlook in October.
Management sees growth slowing down. And while churn rate is below 0.5%, they need to find opportunities to keep growing in the future.
Their goals are ambitious, and they have provided something I have never seen for a Japanese company, which honestly was surprising.