
Is Fiserv an easy double?
The rundown

In this new bi-weekly newsletter, I give you an overview of:
1. The bubble meter
2. A stock in my funnel
3. An article you must read
4. An AI Tool for stock investing
5. A prompt that you can copy/paste
1. The Bubble Meter
“We look at some metrics to gauge what the market temperature is.”
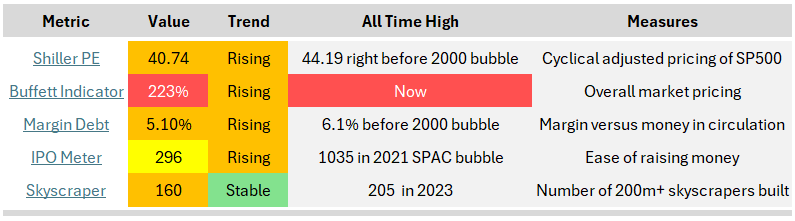
The Shiller PE approaches a record. The Buffett indicator is at an all-time high. Margin debt is soaring. The IPO market is reasonable, and they keep building skyscrapers like there’s no tomorrow.
The market looks hot, but I believe it can continue to stay hot for a while longer.
Only 10 companies carry the current S&P 500 multiple. The magnificent seven are shifting from low-capex businesses to high-capex monsters. Will future earnings pressure due to increased depreciation be compensated by additional AI revenue?
Not in the short term.
Earnings growth of the TOP 10 versus the rest of the S&P 490:
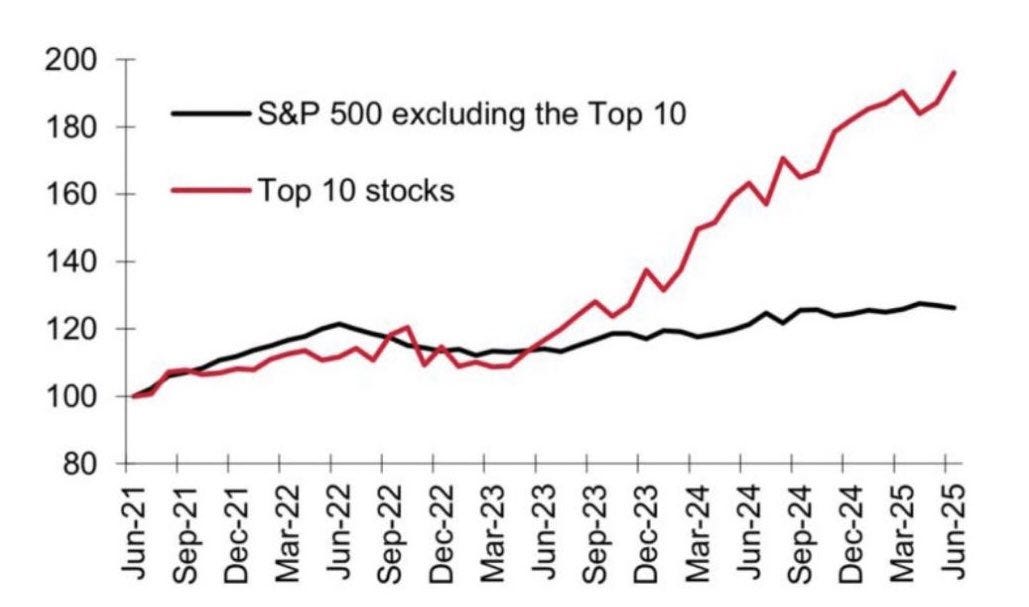
This is a power law in action. Your S&P 500 index is up 17% YTD?
You better thank the 10!
What I’m doing: Stay invested, keep hunting in the smaller space. I have cash on the side, but not looking to hoard.
2. Stock in the funnel
“Short write-up on a company in my funnel”
Description: FiServ (Ticker: FI) is a payment processor, getting a fee on digital, debit, and credit card transactions. It sells its POS system called Clover to merchants. It provides card issuance. In 2024, they had about $18 billion in revenue, half from merchant solutions and half from financial solutions. FiServ’s main competitors are FIS and Global Payments (where companies like Adyen, Stripe also compete, but are more focused).
Type: Bigger company in temporary downturn
Why it’s interesting: I usually stay smaller, but when stuff like this happens, it reminds me of when Adyen dropped 40% in a day and I doubled my position in 3 months. The big question is: Is the market overreacting? Is this a temporary downturn?
What happened? Let me show you an image:
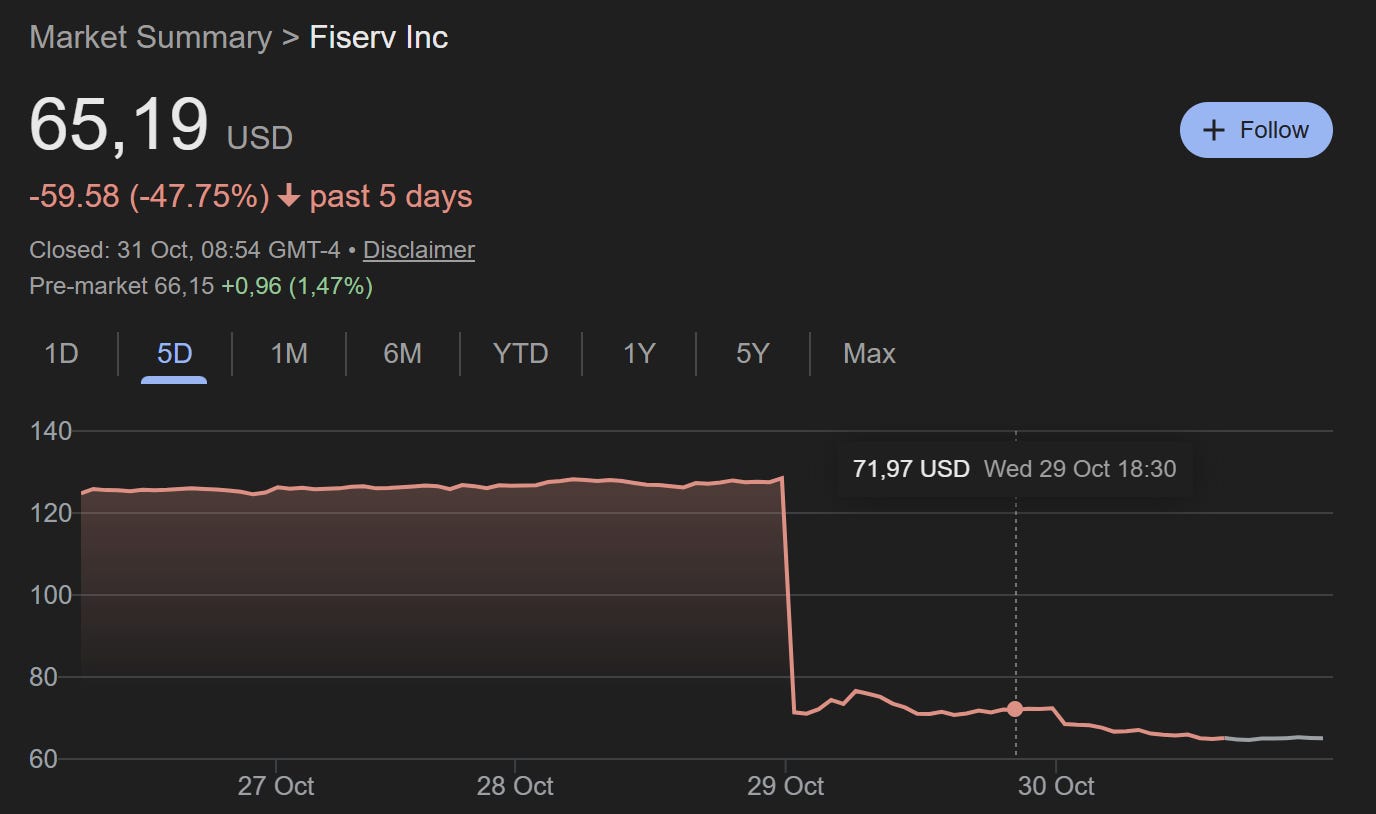
On the 28th of October, Fiserv announced it would be resetting its business:
New leadership (New CEO, Mike Lyons, with an overhaul of the C-suite. New blood from ex-stripe and ex-global payments.
Divest non-critical business units, no longer accept short-term revenue initiatives, and implement an AI-wide program across all its business segments
The kicker: It lowered its guidance. Revenue growth from 10% to 4% in 2025. The EPS estimate was lowered by 15%. And announced a “back to growth plan from 2027 with double-digit EPS growth”.
The rundown: Turnarounds are always hard. And this is not your “Oh my god, the ship is going down, we need a miracle” type of situation. This company is still generating a lot of cash. It has indeed revised their future growth, and honestly, Q1 wasn’t that great either. The trailing P/E has dropped from about 20 to 10. Before the news, the market expected a 10% EPS growth rate (so they priced the company at a PEG of 2). That means the current drop is justified since EPS growth expectations have halved.
So the bet becomes: Do we think leadership is right, and from 2027 can grow EPS at double digits? If yes, we can make money because you would be buying the stock at a PEG of about 1, and if it increases growth, a rerating would be logical.
Current Status: It feels like the market might have gone too far, but more research is needed. It’s never easy, though. I will inform you through the chat by next week.
Subscribe to join the chat ⬇️
3. Best article of the week
“The best pick of what I read”
Surviving the AI Capex boom: History shows that massive capex booms always end in overinvestment. The data support that companies whose asset base grows underperform. The technology is important, but it might be better to focus on early adopters of the AI Boom instead of focusing on Infrastructure plays with sky-high valuations. And if you think, yeah, but in dollars, the past was worse, right? Take a look at this chart:
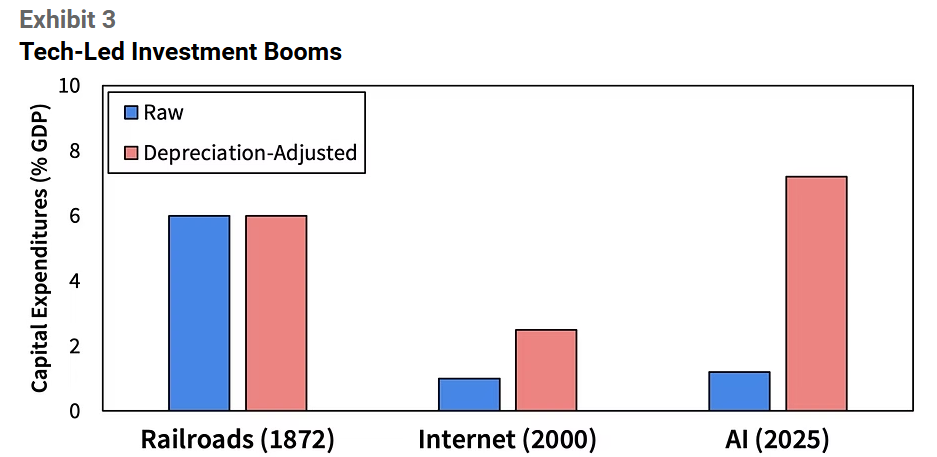
The magnificent 7 capital intensity is approaching that of utilities!

Sparkline gives an overview of what they consider the cheaper basket of AI stocks at the moment.
There’s a lot more inside. Just read it.
4. AI Tools for Stock Analysis
“An AI software tool in the investing space that caught my attention”
I’ve never used Notion before. A productivity tool to sync different databases, work across teams, and increase efficiency. You see these posts about small companies building a business Operating System, so I was wondering if anyone had been experimenting to build this for equity analysis.
It seems someone has:
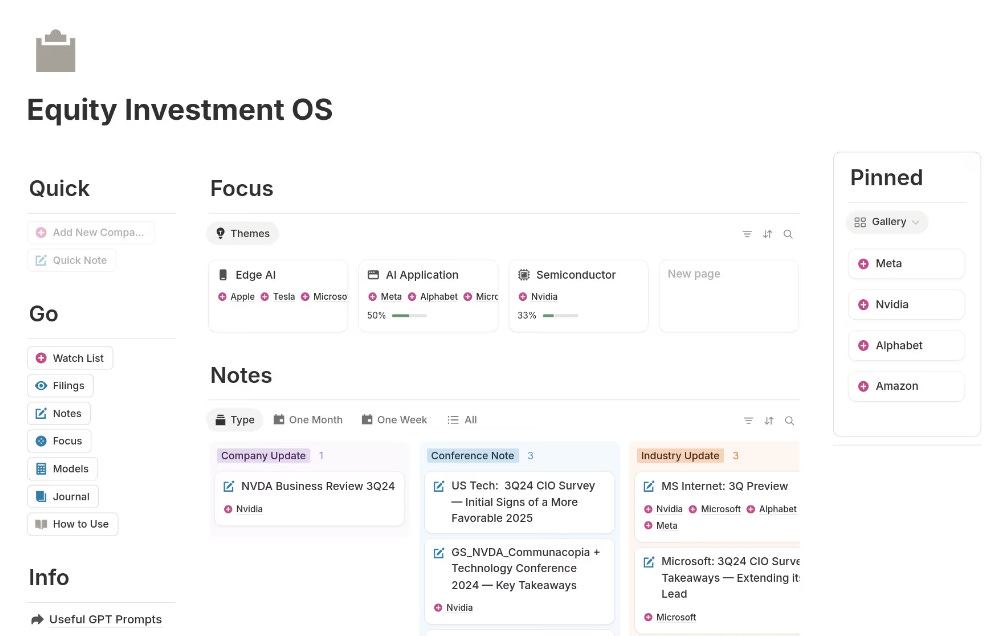
Combine this with automation, good financial data, and you’ll be able to analyze a lot more stocks in the same amount of time.
This will be included in our future course.
I’ll show you how to do this.
5. Prompt of the week
“An advanced prompt that is actually useful”
When using GPT-5, you feel awesome, right? What do I mean by this?
Watch this video ⬇️
Source: Alexandra Ozerianska
There’s a lot of truth to it.
You can overcome this by asking GPT-5 to tone it down. Or when you’re analyzing a stock, use GPT-5 as a short, focused equity analyst.
Copy/paste the prompt below and test it out on one of your companies.
We’ll tackle this and other problems to get more reliable results in our upcoming course, “Invest with GPT”. The waitlist is still open.
May the markets be with you, always!
Kevin
P.S.: Let me know what you think of this format!
The “short” prompt. Replace “CompanyName” & “Ticker” inside the prompt.
TITLE: Short-Focused Hedge Fund Dossier – {CompanyName} ({Ticker})

ROLE
You are a skeptical equities analyst at a short-focused hedge fund. Your mandate is to uncover where the business could fail, quantify downside, and map catalysts that could pressure the stock over the next 0–24 months. Maintain professional, evidence-based standards and avoid conjecture.

DATA
- Primary sources: regulatory filings (10-K/20-F/40-F, 10-Q, MD&A, notes, auditor opinions), footnotes, segment disclosures, risk factors, prospectuses/shelf filings; earnings call transcripts; investor decks; press releases.
- Regulatory & legal: sector-relevant regulators, licenses/approvals, enforcement actions, litigation dockets, consent decrees, antitrust matters, environmental/safety records, labor rulings.
- Market/trading: share count & float, short interest, days-to-cover, borrow rate/availability, insider transactions, ownership structure, index inclusion, liquidity (ADV, % float traded).
- Competitive & industry: peer comps, pricing changes, switching costs, channel checks, substitute/entrant threats, supplier/customer concentration, contract terms/renewals, supply chain dependencies.
- Temporal scope: last 5 years minimum; include older items if directly relevant (e.g., legacy liabilities, long-term contracts).
- If browsing tools are available, search widely and cite sources. Prioritize primary sources; corroborate secondary sources.

TASK
Produce a concise, evidence-backed short report on {CompanyName} that:
1) Identifies 3–5 core bearish pillars (each: what, why it matters, evidence, magnitude, timing).
2) Quantifies downside via simple scenarios and benchmarks (peer/precedent multiples or unit economics).
3) Maps near-, mid-, and long-term catalysts with probability and impact.
4) Highlights accounting/forensic red flags and governance/compensation misalignments.
5) Surfaces “what could go right” and key disconfirming evidence.
6) Counts and lists bearish articles/notes found during research.

REASONING INSTRUCTIONS
- Use a structured protocol:
  a) Business snapshot: revenue mix, unit economics (price/volume or ARPU/churn/LTV/CAC), drivers, geographic/product exposure.
  b) Red-flag scan: revenue recognition, accruals vs. cash, one-offs, KPI redefinitions, non-GAAP add-backs, working capital swings, related parties, contingent liabilities, auditor changes.
  c) Industry risks (adapt per sector): competitive intensity, price wars, technological disruption, regulation/permits, contract renewal risk, customer concentration, supply chain fragility, capex overruns.
  d) Liquidity & squeeze risk: cash runway, covenants, refinancing needs, float/SI%, DTC, borrow cost.
  e) Valuation pressure points: multiple re-rating, margin normalization, growth deceleration, FX/commodity impacts, capital needs/dilution.
- Quantify wherever possible; show simple math for scenarios (revenue/margin/EV or P/E bridges).
- Cite sources inline for every non-obvious claim with dates. Prefer primary filings.
- Keep internal deliberation private. Provide only the requested sections and conclusions; do not reveal step-by-step chain-of-thought.

OUTPUT FORMAT (Markdown)
# Short Thesis Dossier: {CompanyName} ({Ticker}) — as of {AsOfDate}

**Executive Summary (≤120 words)**
- Bear thesis in 3 bullets.
- Indicative downside range and time horizon.

## Bearish Pillars (3–5)
For each pillar: **Title** — *What & Why*; **Evidence** (1–3 sourced bullets); **Magnitude** (impact on revenue/margin/valuation); **Timing** (0–3m, 3–12m, 12–24m); **Confidence** (Low/Med/High).

## Forensic & Governance Red Flags
- Accruals/quality of earnings (CFO vs. NI, WC build/decline, one-offs)
- Disclosure anomalies (segment/KPI restatements, unusual metrics)
- Auditor/opinion/going-concern notes; related-party transactions
- Compensation & incentives misalignment; capital allocation history
*Cite exhibits, page numbers.*

## Industry & Competitive Pressures (Generic)
- Market structure & pricing power; switching costs; substitution risk
- Entrant/tech disruption map; product obsolescence risks
- Customer/supplier concentration; contract duration/renewal cliffs
- Supply chain/capacity constraints; logistics/geography exposures
- Regulatory/licensing/ESG constraints; litigation overhangs
*Cite industry reports and filings.*

## What Could Go Right / Disconfirming Evidence
- List 3–5 items that would invalidate/soften the bear case and how to monitor them.

## Monitoring Plan (Tripwires)
- KPIs & disclosures to watch each quarter; events calendar (earnings, regulatory decisions, court dates, contract renewals, refinancing windows).

## Bearish Coverage Tally
**Number of bearish articles/notes found:** {BearishCount}
Top items (≤10):
1. Title — Publisher — Date — One-line stance. [Link]
…

## Sources & Citations
- Bullet list with links, dates, and brief descriptors.

CONSTRAINTS & STYLE
- Be concise, skeptical, and specific. No ad hominem, no unsourced claims.
- Use bullet points and small tables; avoid prose bloat.
- All figures in {Currency} unless noted. State FX and date if converting.
- If data is unavailable, state the gap plainly and proceed with conservative assumptions.

VARIABLES (set before running)
- {CompanyName}: [e.g., Acme Corp]
- {Ticker}: [e.g., NYSE: ACM]
- {Currency}: [USD, EUR, etc.]
- {AsOfDate}: [YYYY-MM-DD]
- {BearishCount}: [auto-computed during research]
Great post. Thanks, Kev!
Great article! Cheers 🍻