
Measure pricing power in 1 minute with a simple prompt
Your bi-weekly stock and AI rundown

1. Bubble Meter
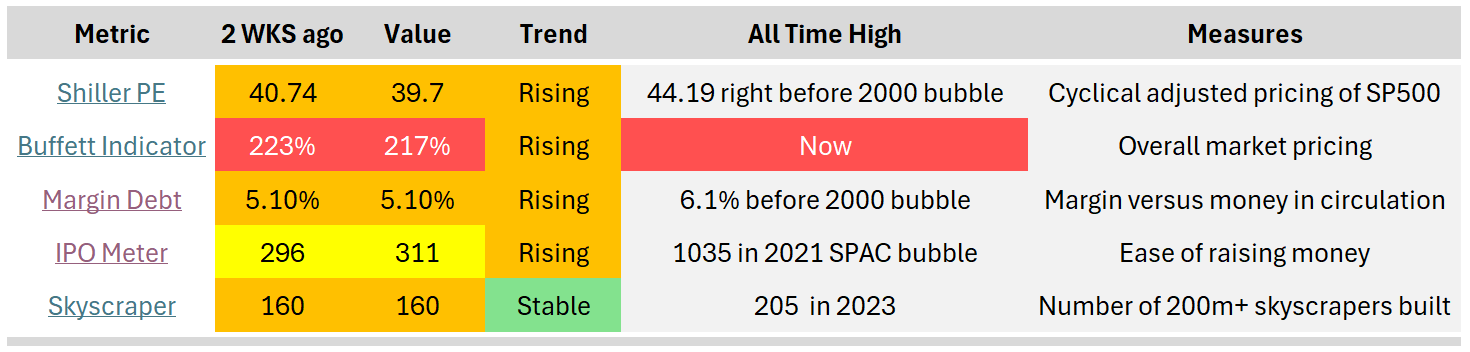
Markets have been cooling off a little bit over the past 2 weeks. But IPO’s are still going strong this year.
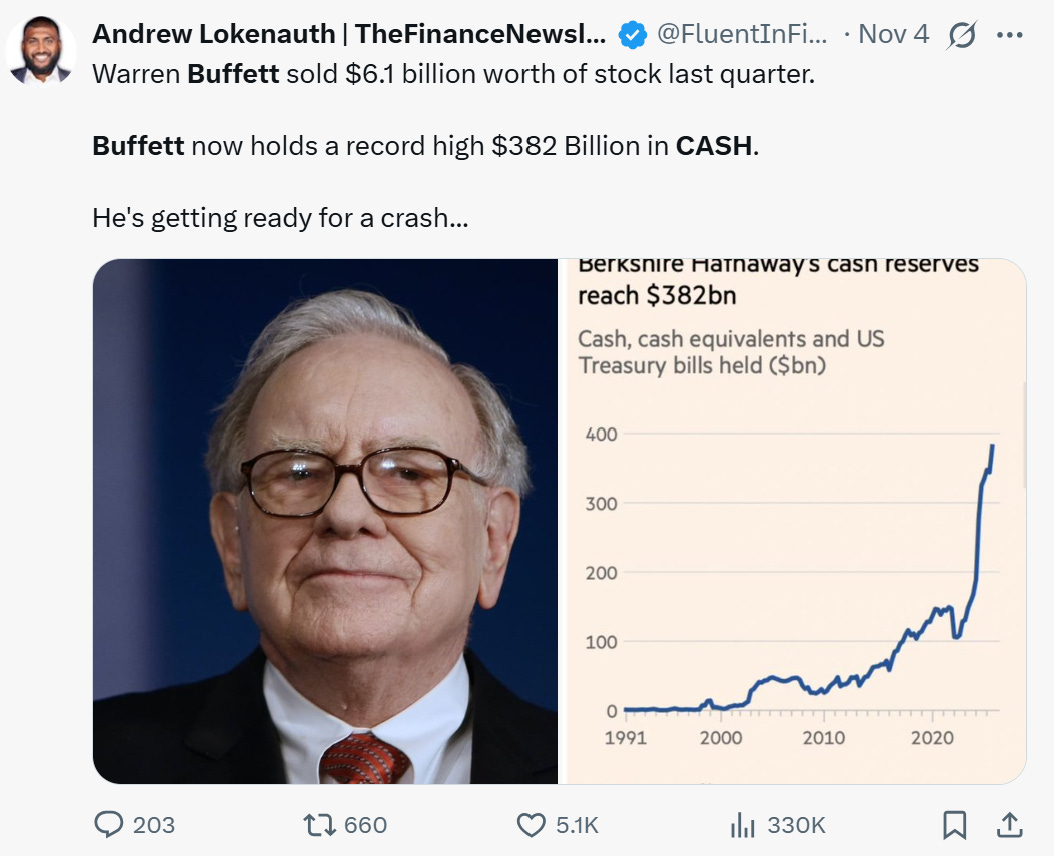
Buffett is sitting on his biggest cash pile since, well, ever…
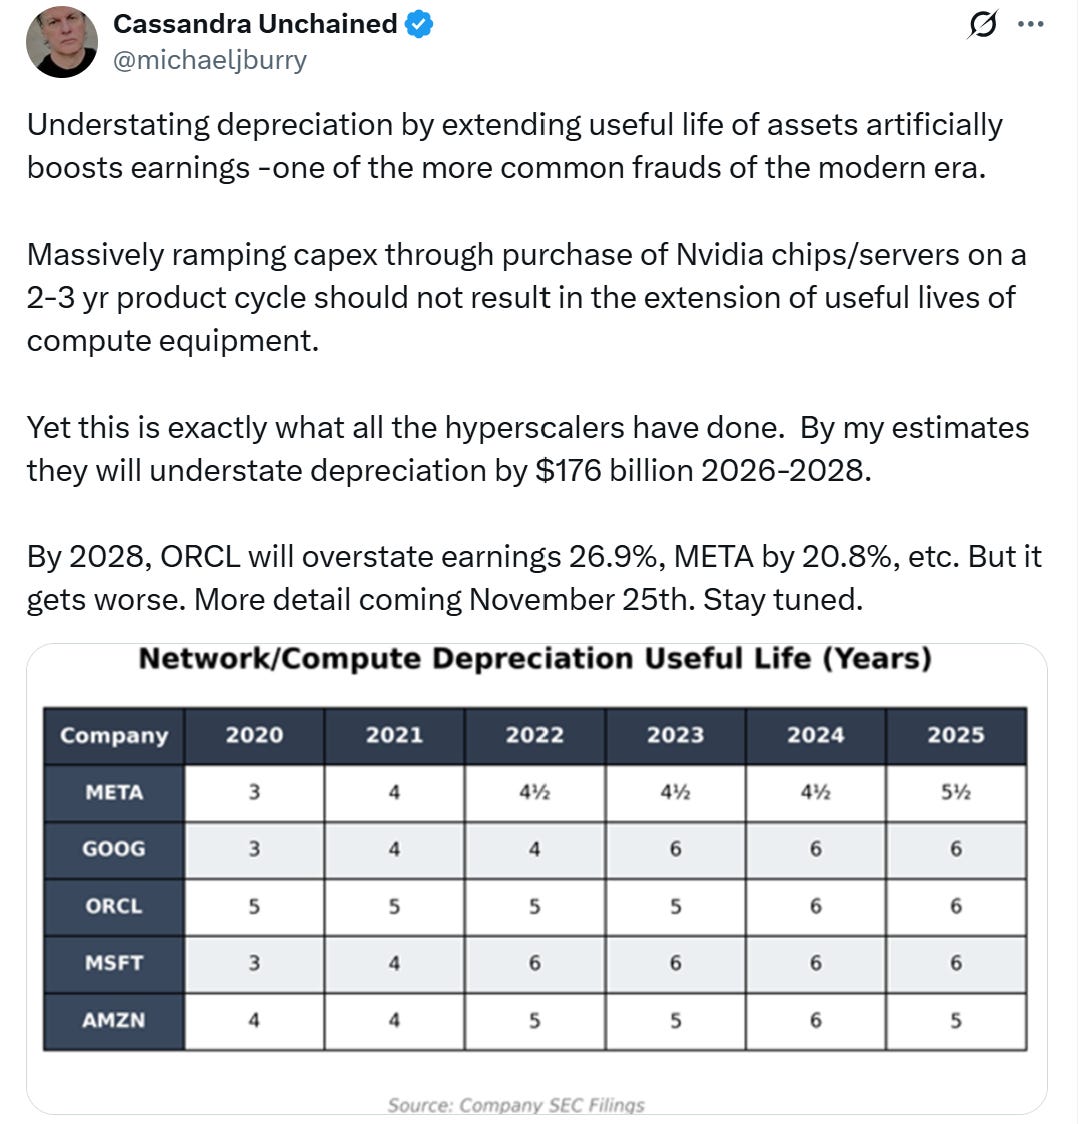
And Michael Burry, the famous big short investor who made a killing on the housing bubble in 2008, announced the shutdown of his hedge fund AND will be launching a blog on the 25th of November.

He also warned about market exuberance (although it seems he does this regularly), stating specifically that hyperscalers are understating their depreciations related to all the capex spending (meaning they are artificially pumping up their earnings).
You know the drill:
Profits are an opinion; cash is a fact.
➡️always look at the cash flows
The fact that one of our portfolios is half in cash is because we have been building it slowly. I’m not the type of investor to worry.
2. Stock in the funnel
2 weeks ago, we talked about FiServ.
I’m still researching it. You can find the pricing power analysis at the end of this article.
But staying in the same vein, I’m digging into Dlocal(Ticker DLO) at the moment.
Description: dLocal is a Uruguay-founded fintech that runs a “one-stop” cross-border payments platform, helping global merchants accept and send payments in emerging markets across Latin America, Africa, Asia, and the Middle East. Through a single API, it lets merchants accept local payment methods, handle FX and local-currency settlement, and then pay out to partners, staff, and users in their currency of choice. On top of this pay-in/pay-out infrastructure, dLocal layers compliance, fraud management, and other value-added services, monetizing primarily via transaction-based fees on the volume it processes.
Type: Fast grower
Why it’s interesting: dLocal looks like an Adyen (although there are differences, Adyen is more vertically integrated and does the extra mile to get licences to be the merchant acquirer), facilitating payments in emerging markets, but is more ingrained in emerging markets. Here’s something I cooked up using AI by parsing data from both companies:
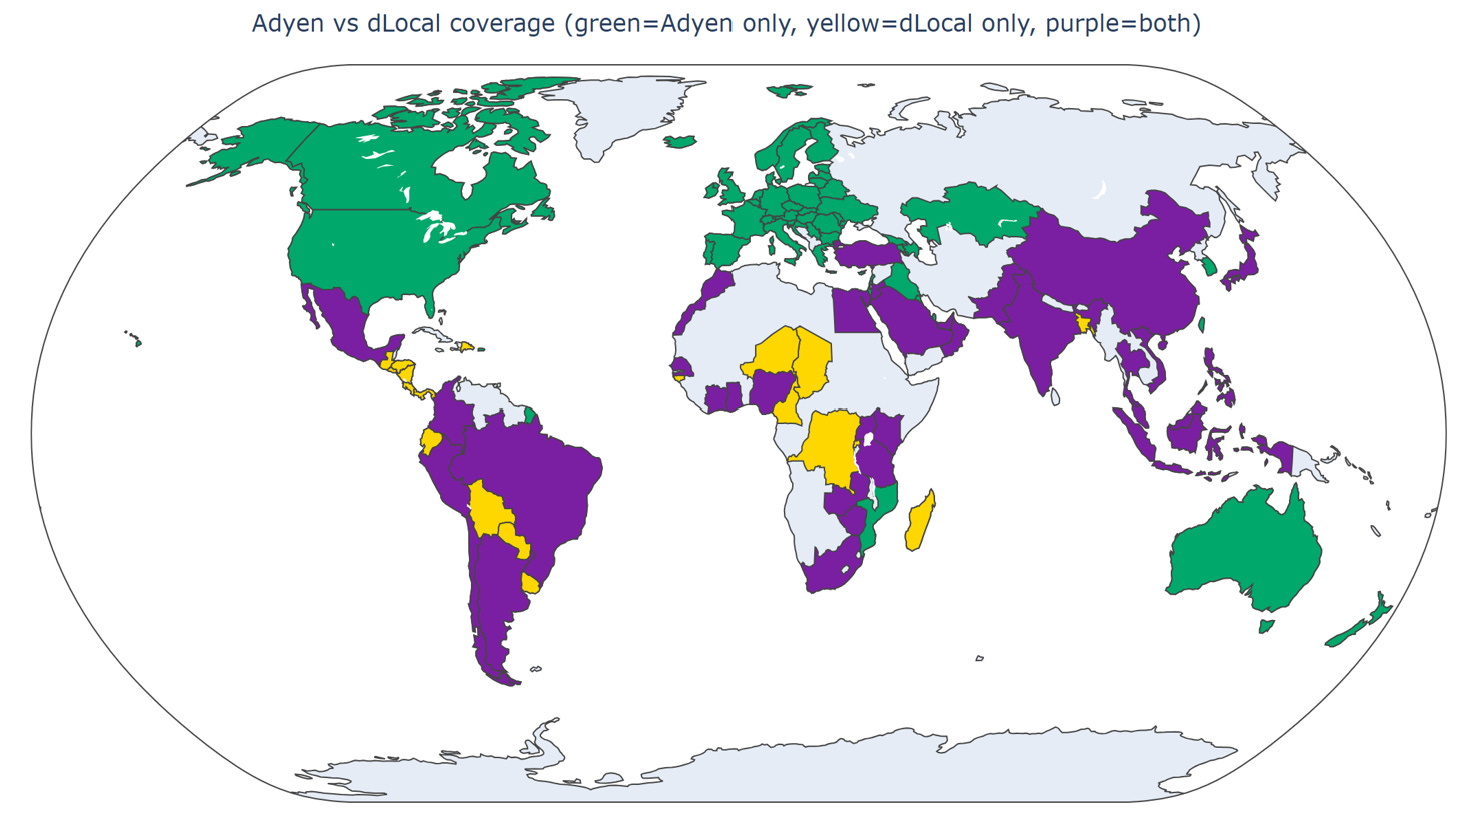
In other words, Adyen is much more geographically present than DLocal. They can be competitors in the purple areas. However, when you look at, for example, the total Latin America revenue between them, Dlocal is a lot bigger (6x).
The rundown: Dlocal had a great quarter, but the decline in take rate made the market push down the price. This reminds me a lot of quarterly calls with Adyen management: “We focus on revenue growth, not on take rate 😉” And since revenue is a combo of take rate and volume…
However, gross margins are in full decline ⬇️
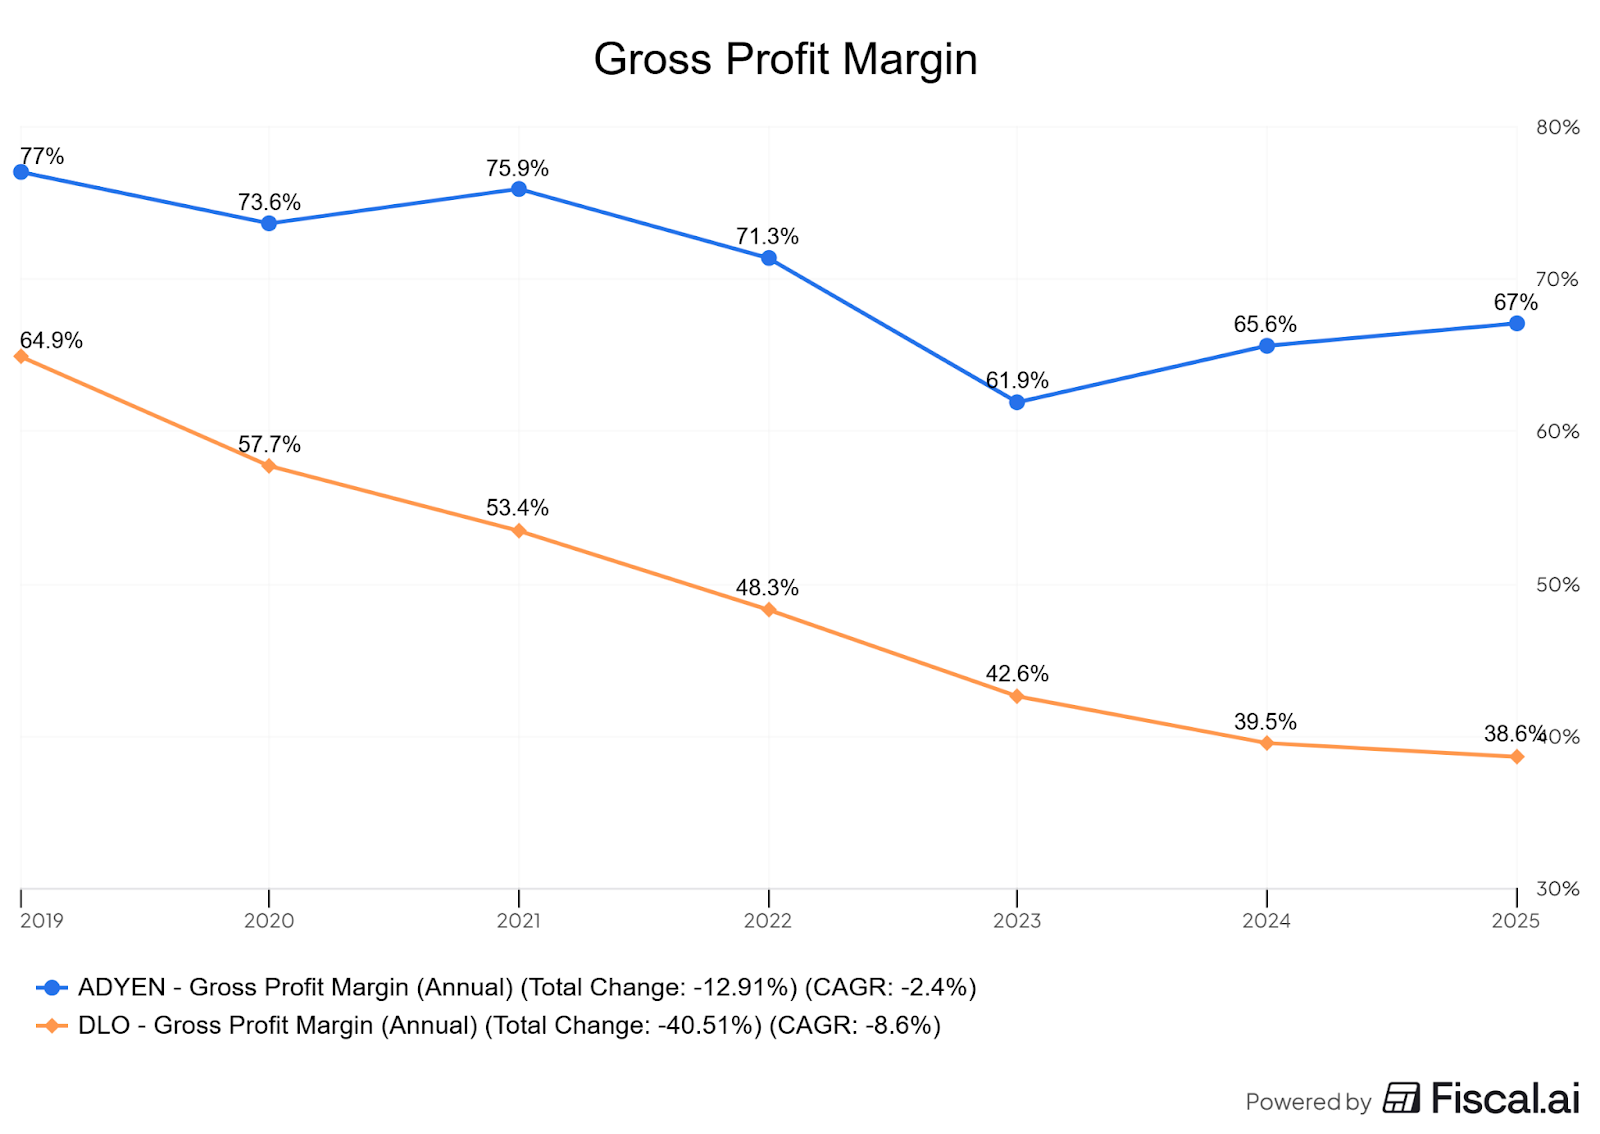
Adyen is better on about every metric, except valuation.
That’s why I’m interested in dLocal.
Current Status: More Research Needed. This company sits within my research funnel, has passed the first filters, and a full article will be published soon.
3. Best article of the week
I consider myself fairly advanced when it comes to using AI Tools for stock analysis. After all, I wouldn’t build a course about it if I didn’t.
If you’re interested, 300 people have already joined.
But Mostpha over at Compound with AI wrote a banger article that combines my love for process and AI.

If you’ve read the articles of Michael Mauboussin, he always argues to start with the lay of the land or an industry overview.
But before we had these AI Tools, that was a lot of work. Creating an industry full profit pool? Yeah right.
AI has taken us a step closer to doing such an analysis. In the article, you’ll discover the process and the 3 prompts to do so.
A must-read!
4. AI Tools for Stock Analysis
“An AI software tool in the investing space that caught my attention”The pick was easy this week. I started using Perplexity Comet, the new AI-first browser from Perplexity, and it feels a bit like magic. (no affiliate or anything)

When it comes to stock analysis, what can you do?
In just a couple of minutes, I was able to pull data from a website into a Google Sheet and start charting. You have the website open in the browser, and just use the right prompt to get the data.
I had the Dlocal earnings report open in the browser. You click summarize, and it provides you with a summary in 1 second
Do you want to study a company? Ask it to fetch the sources you want, Perplexity will start opening the tabs with the documentation. You can then go through these one by one or ask it additional instructions
And finally, you can turn it into a watchdog (but you’ll need Perplexity Pro). For example, you can make it check an investor relations website every week and send you an email with the update.
These tools are getting more and more powerful. Comet excels with the speed it delivers. I’ll add a module in the video course as I think it can complement the use of GPT-5.
5. Prompt of the week
Pricing power is one of the important aspects to assess for any business.
Don’t take it from me, take it from the master:
The ‘Single Most Important’ Trait in a Business Is Pricing Power. If You Need A ‘Prayer’ To Raise Prices, It’s A Terrible Business
- Warren Buffett
Let’s dive a little deeper into pricing power and what the telltale signs are.
1. Price increases
The first thing is to simply check if the business has increased prices for its products over history (and still grows revenue). We’re looking for price hikes that do not reduce the sales volume.
One of the best examples is, of course, the iPhone.
Upon its first introduction, it was priced at a whopping $499 (about $799 today). And below you can find what is called the Stairway to Heaven. On the left, you have the historical prices for all the models, and on the right, the inflation-adjusted pricing.x
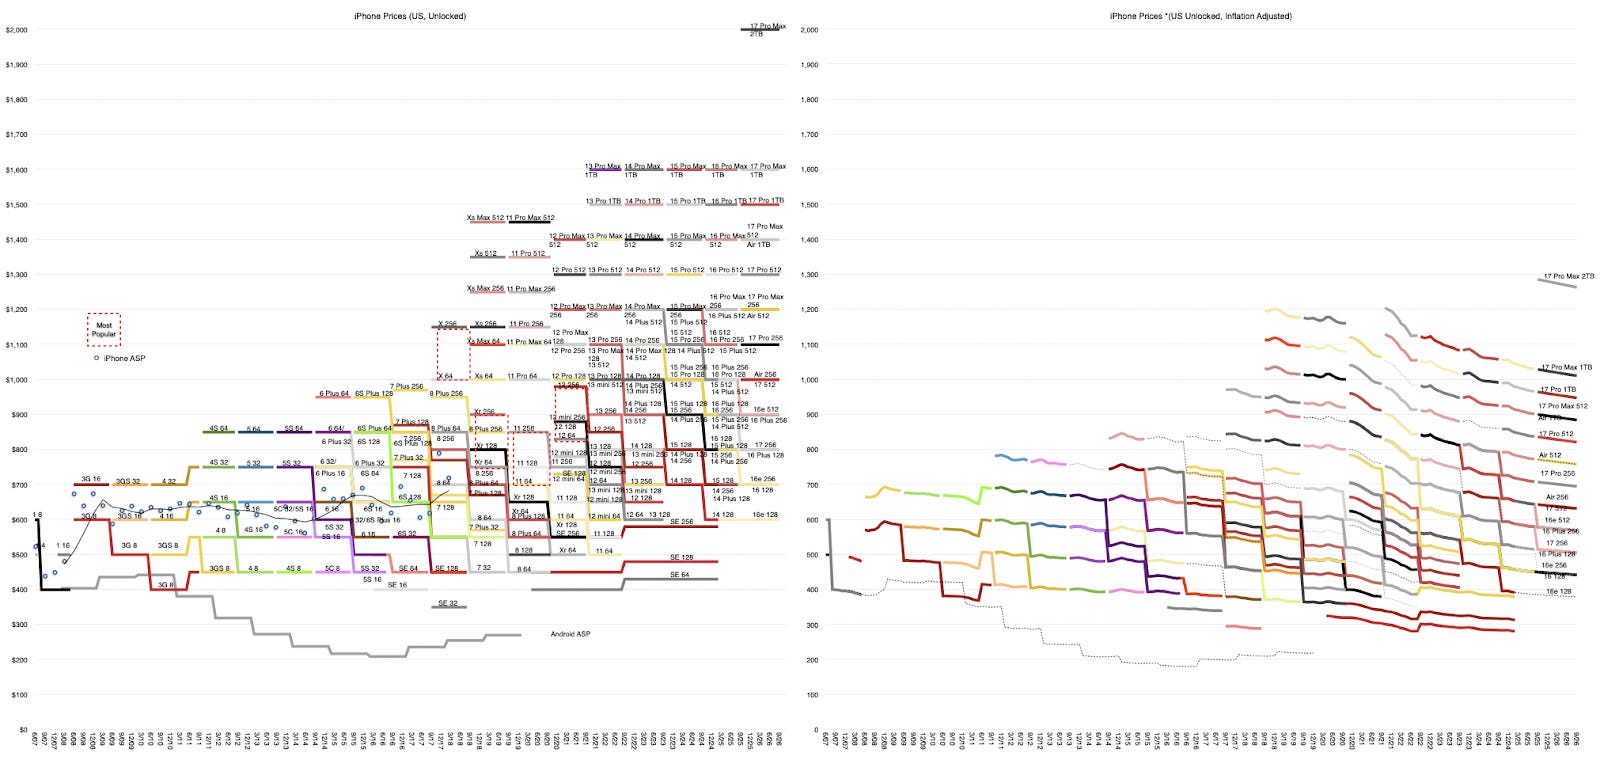
No wonder Buffett bought the company in 2010. A company with pricing power traded at a P/E of 10.
2. Gross Margins
High gross margins, and ideally increasing gross margins, can signal pricing power, especially when those gross margins are higher than its direct competitors. High gross margins give the business flexibility and options. If your gross margins are 20%, that means your COGS (Cost of Goods Sold) already took a large part of the price you charged to your customer. You don’t have a lot of cash left to work with.
High, stable, or increasing gross margins can be a second signal towards pricing power.
For Apple, these have been between 35% and 40% and rising over the last 3 years.
3. Market share
If a company maintains or even expands its market share while charging more than its peers, that’s the holy grail of pricing power.
This often reflects brand strength, switching costs, or superior customer experience. The company is winning not because it’s cheapest but because it’s worth more.
The data on this one can be trickier to come by.
4. Bonus: Customer satisfaction through NPS data.
The Net Promoter Score gives a value on how a business’s customers would refer their brand or products to friends or family.
Sometimes, companies will provide this data in their investor presentation. But not always (or they don’t track it, or they do, but the value is low 😉).
Here’s what to look for:
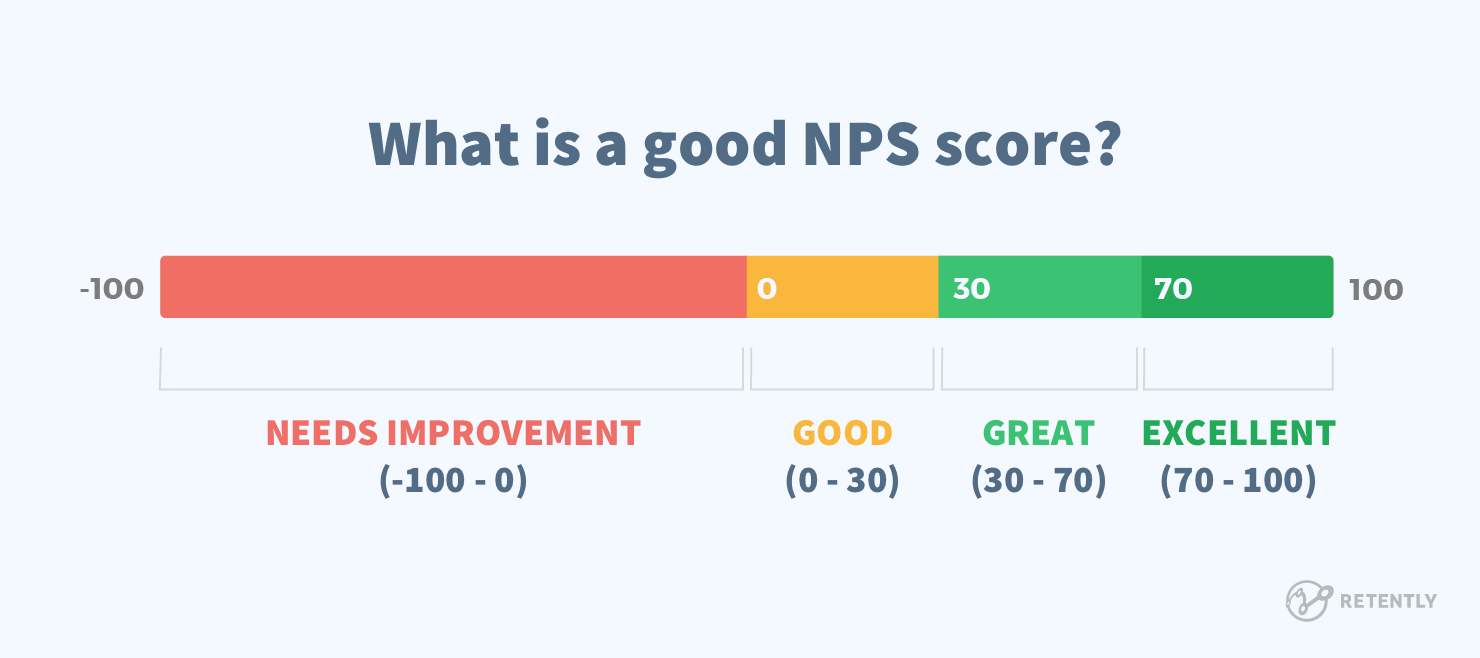
You can imagine that when selling a product or service with a low NPS score, the business can’t start hiking its prices. (Note: This isn’t always the case; you could imagine a business paying for an ERP system, which is sticky. Even if they are not happy with the system and it has a low NPS score, switching to another one would be a huge pain.)
A high NPS means the customer is less price sensitive. So the business could try to increase its prices.
Now, let’s put this into a prompt you can use.
Prompt Result
So we used it on Fiserv and GPT5.1 and got this:
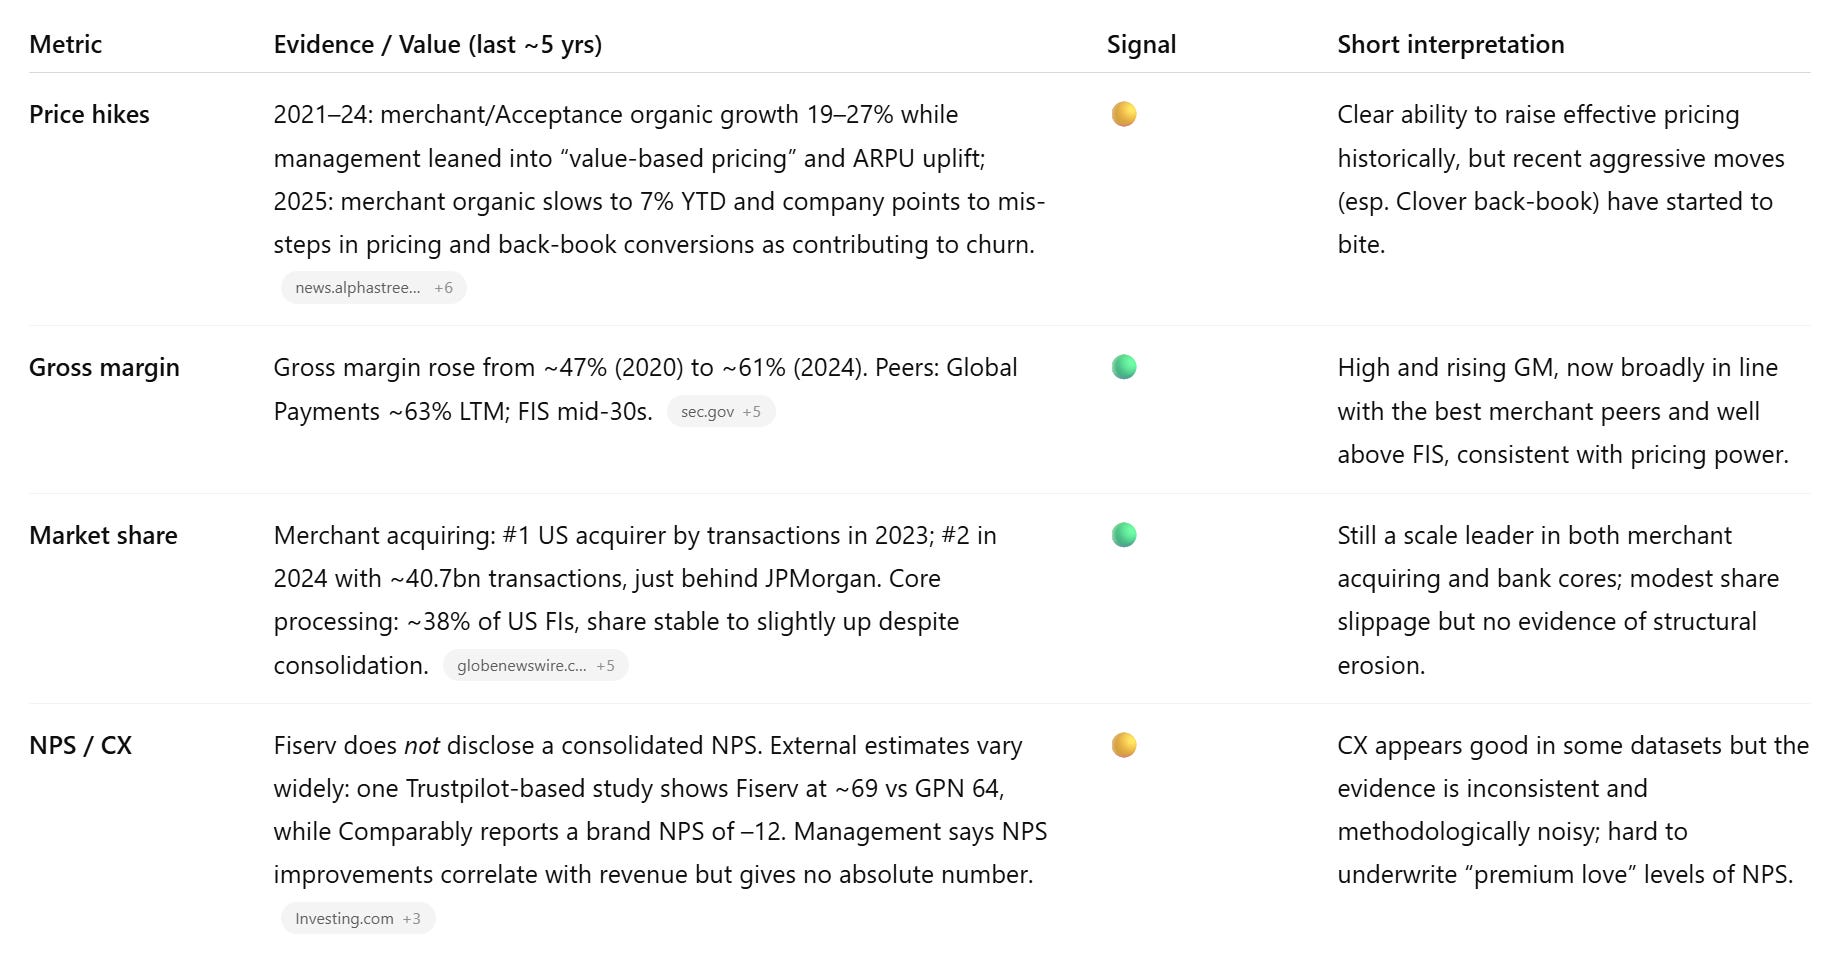
It concludes that:
Overall: Compared to Global Payments, Fiserv shows similar or better gross margins, a stronger bank-tech franchise, and comparable merchant scale, all pointing to solid underlying pricing power. The 2025 reset, Clover-related churn, and lawsuits, however, demonstrate that management can over-reach on price/mix. I’d characterise Fiserv’s pricing power today as good but currently stressed, not broken.
The prompt
Copy/paste this prompt in your LLM of choice
TITLE: Pricing power analysis {CompanyName} ({Ticker})

ROLE

You are an equities analyst specializing in moat and pricing power analysis. Your mandate is to use past data and assess if the company in question has pricing power or not. Maintain professional, evidence-based standards and avoid conjecture.

DATA

- Primary sources: regulatory filings (10-K/20-F/40-F, 10-Q, MD&A, notes, auditor opinions), footnotes, segment disclosures, risk factors, prospectuses/shelf filings; earnings call transcripts; investor decks; press releases.

- Competitive & industry: peer comps, pricing changes, switching costs, channel checks, substitute/entrant threats, supplier/customer concentration, contract terms/renewals, supply chain dependencies.

- Temporal scope: take into account the last 5 years of data

- If browsing tools are available, search widely and cite sources. Prioritize primary sources; corroborate secondary sources.

TASK

Produce a balanced, evidence-backed short report on {CompanyName} in the following structure

1) Past price hikes

2) Gross margin analysis

3) Market share evolution

4) NPS comparison to competitors (if applicable)

REASONING INSTRUCTIONS

- Use a structured protocol:

  a) Look through past filings and investor presentations to find clues on past price hikes. Did these price hikes of their product or services impact sales volume? If not, then this could be a pricing power signal.

  b) Verify value and evolution of gross margins. Pricing power can be signaled by companies with high gross margins (>40%), by gross margins that are increasing, especially when compared to competitors. Include the data from direct competitors in the analysis.

  c) What is the size of the market share of the company and is it increasing, decreasing? A company that keeps on building market share has a good change of having some kind of pricing power.

  d) Does the company report an NPS score on its products or services? Is it above 70? How does it compare to its competitors?

OUTPUT FORMAT (Markdown)

# Create a table with a traffic light output.

The table has 1 row for each metric: Price hike, Gross Margin, Market share, NPS score

The table has 3 columns, one for the metric, one for the value, one for the traffic light and one with a short description.

**Executive Summary (≤500 words)**

Provide a summary explanation of the pricing power of this company. Compare it with at least 1 competitor.
I hope you liked this second edition of this type of post.
May the markets be with you, always!
Kevin
Some great advice on using AI the right way. Thanks Kevin!
I'd stay clear of AI browsers. Researchers found it vulnerable to "indirect prompt injection" attacks via hidden content or screenshots, letting hackers siphon your logged-in data without you knowing. Some tests even showed it getting tricked into bogus purchases or malware downloads.