
This tool has saved me hours on stock research
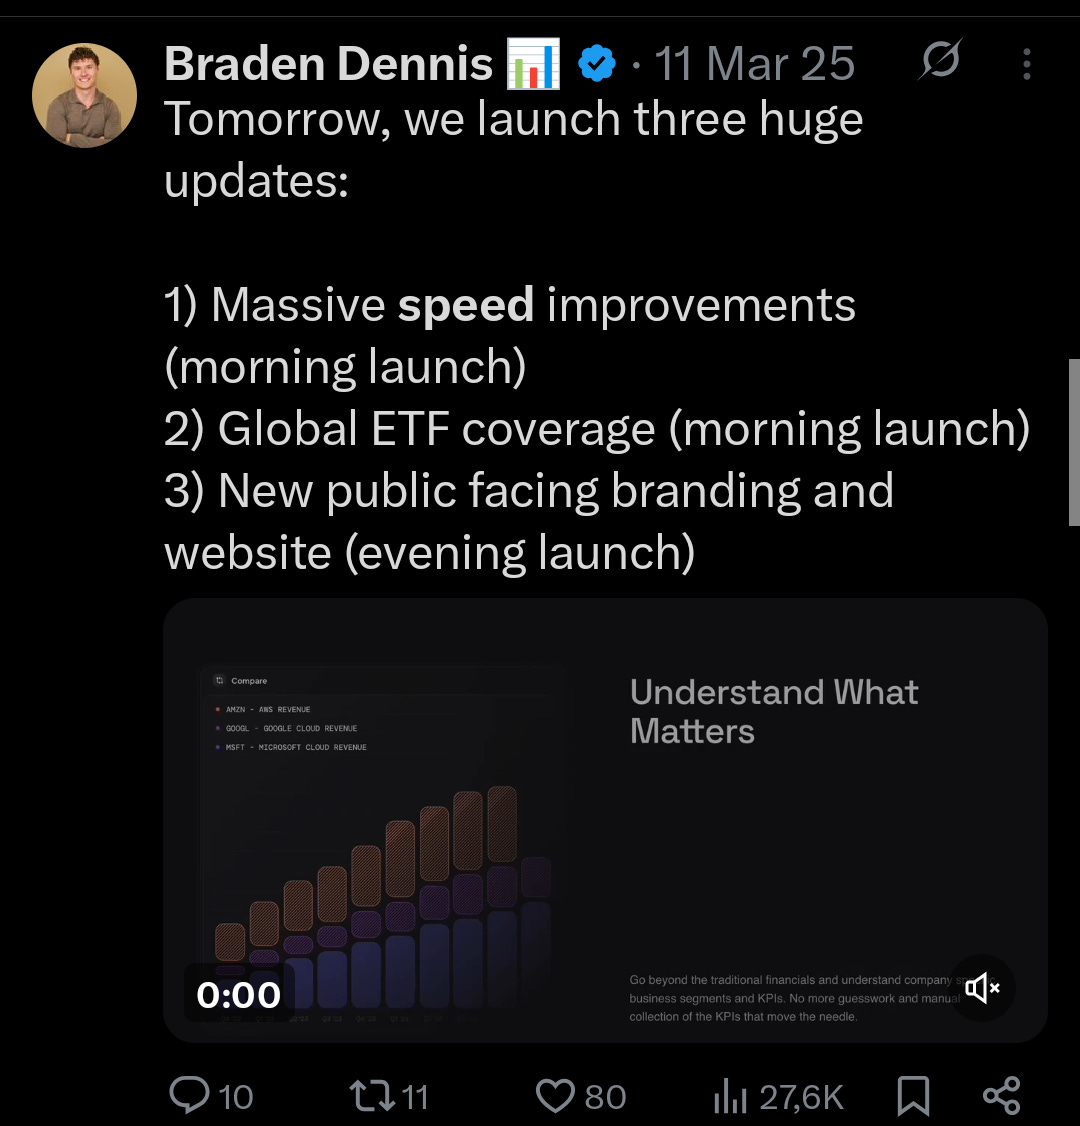
Fiscal.ai 5 incredible features

Fiscal.ai is a stock analysis tool that I use on a daily basis.
And I only recommend tools to others that I actually like and use. (full tech stack incoming in about a week).
So here are 5 incredible features why I think fiscal.ai should be part of your stock research workflow.
Note: Fiscal is running their 25% off sale. It ends tomorrow. So if you want to grab a discounted subscription, you have 1 day left to profit from their promotion.
1 Financials: Custom Metrics
Fiscal.ai allows you to create your own custom metrics. Each business should be viewed with a different lens.
Take a business like MELI for example where most investors say the name in the same breath as Amazon. (Meli is a different beast though).
But one thing they have in common: The business is not optimized for profits. Management invests and takes a long-term approach.
The result is that a combination of popularity, and not optimizing for profits, make it so that their P/E multiple is always high.
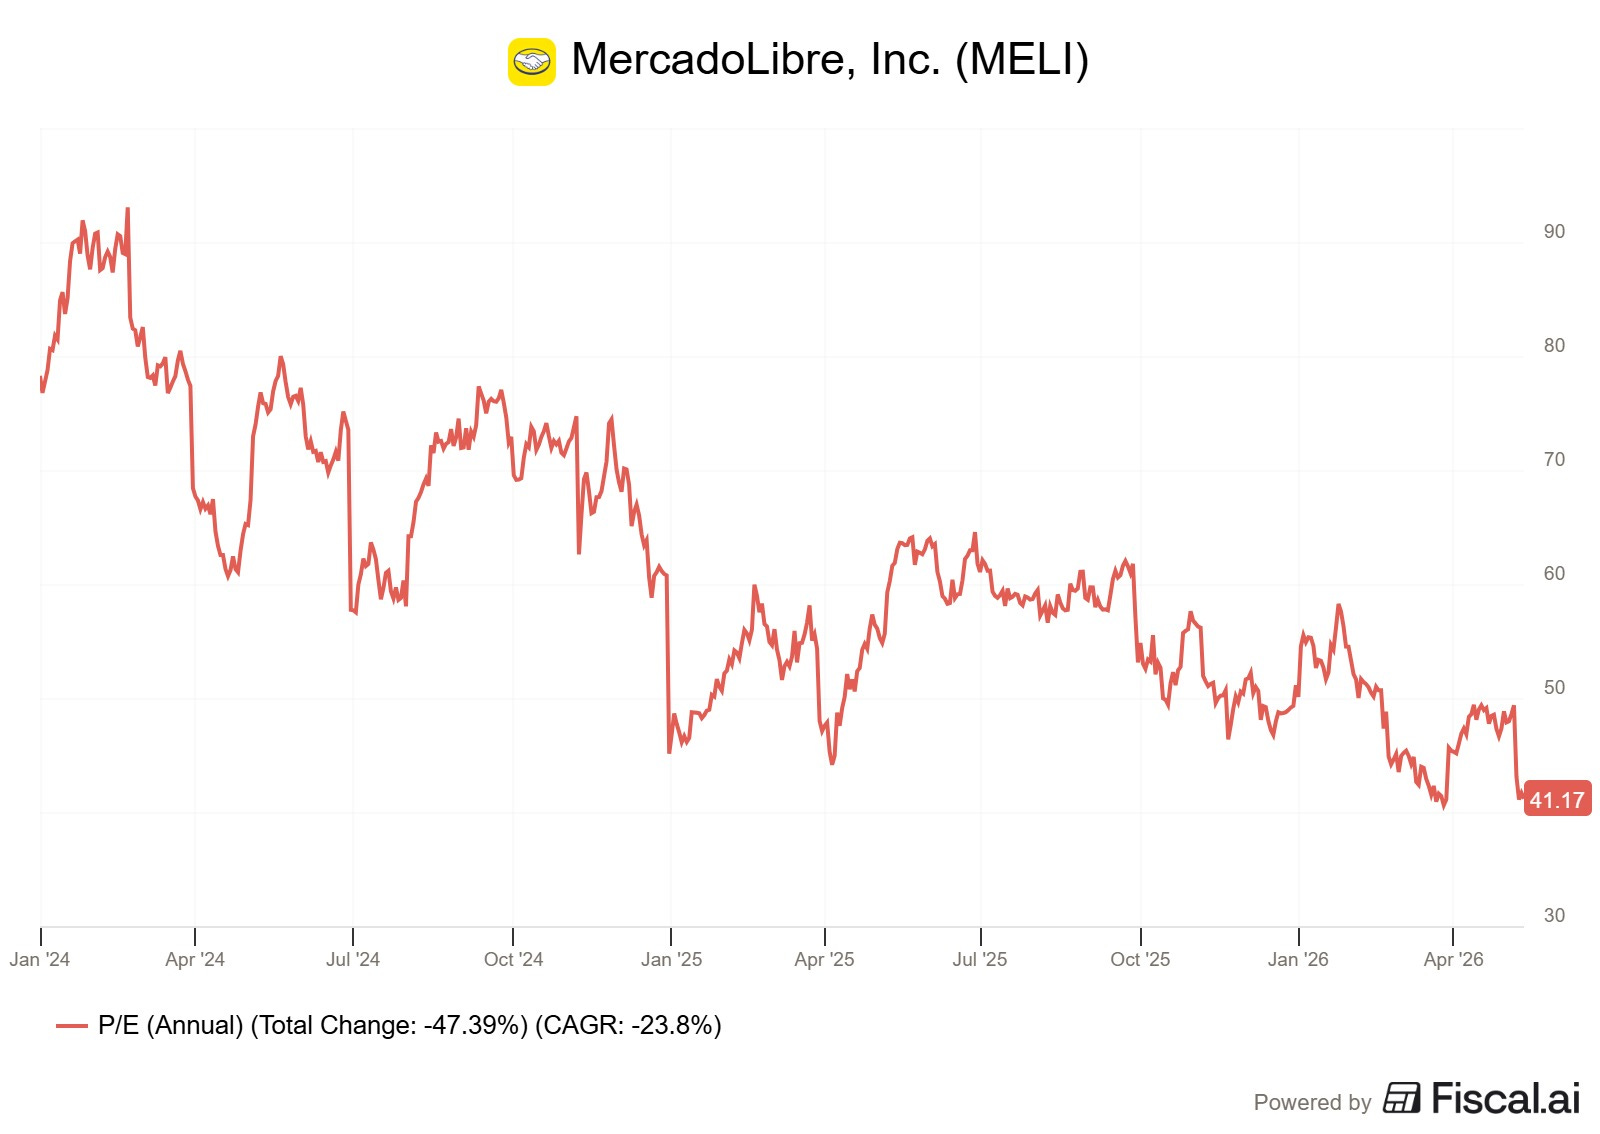
But is the P/E ratio the right ratio to look at?
Meli combines online retail with finance. It invests for the future. Net income might not be the right metric. You could consider cash flows, but same thing. Free cash flow will vary with investments and be distorted by cash deposits on the balance sheet (which you can’t count upon).
Also, you’re not taking into account the growth of the company. Static, trailing ratios have no real use when you have a company growing at 30%+ each year.
So here’s what fiscal allows you to do.
Create a custom ratio.
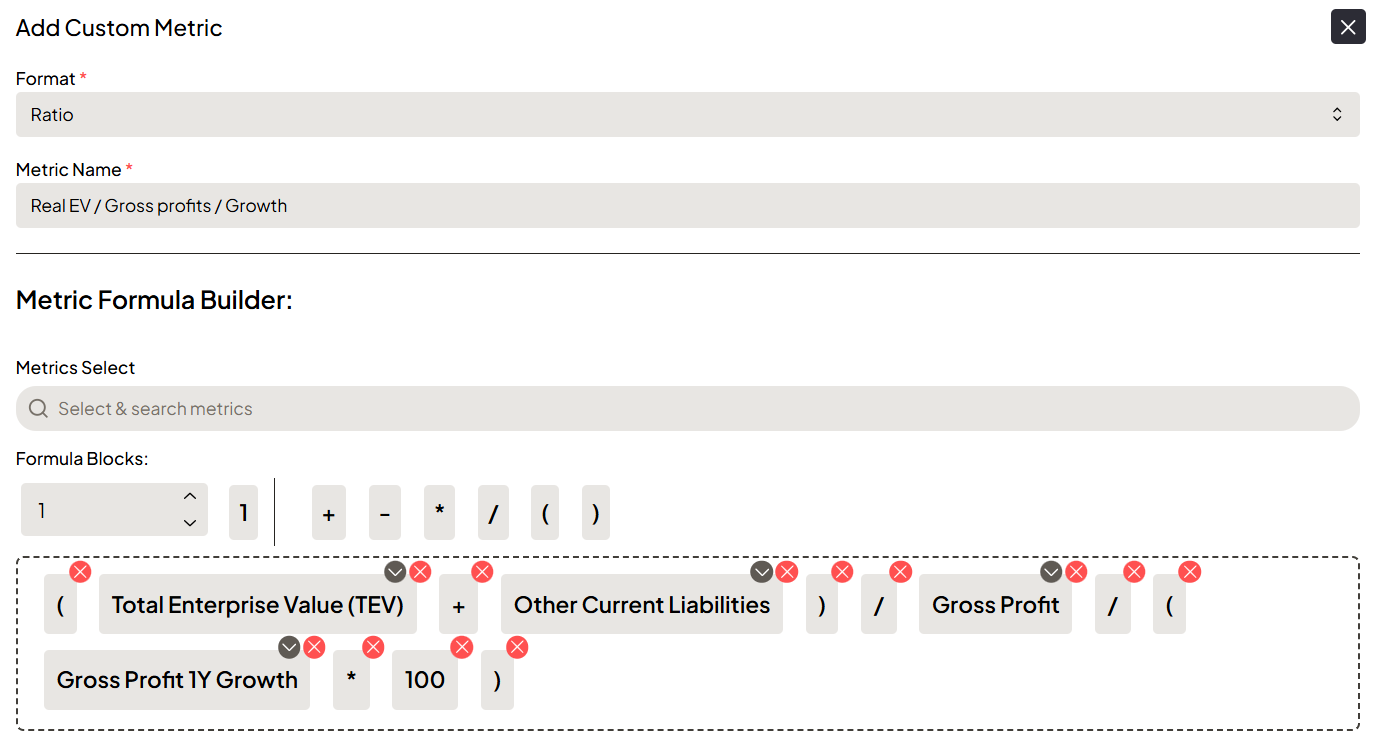
This ratio is the EV/GP/G ratio.
Correct the Total Enterprise Value for the cash deposits
Divide by the gross profits
Divide by the gross profits growth (I took 1 year, but you can take 3 years)
When we plot this in fiscal, we get this (blue line):
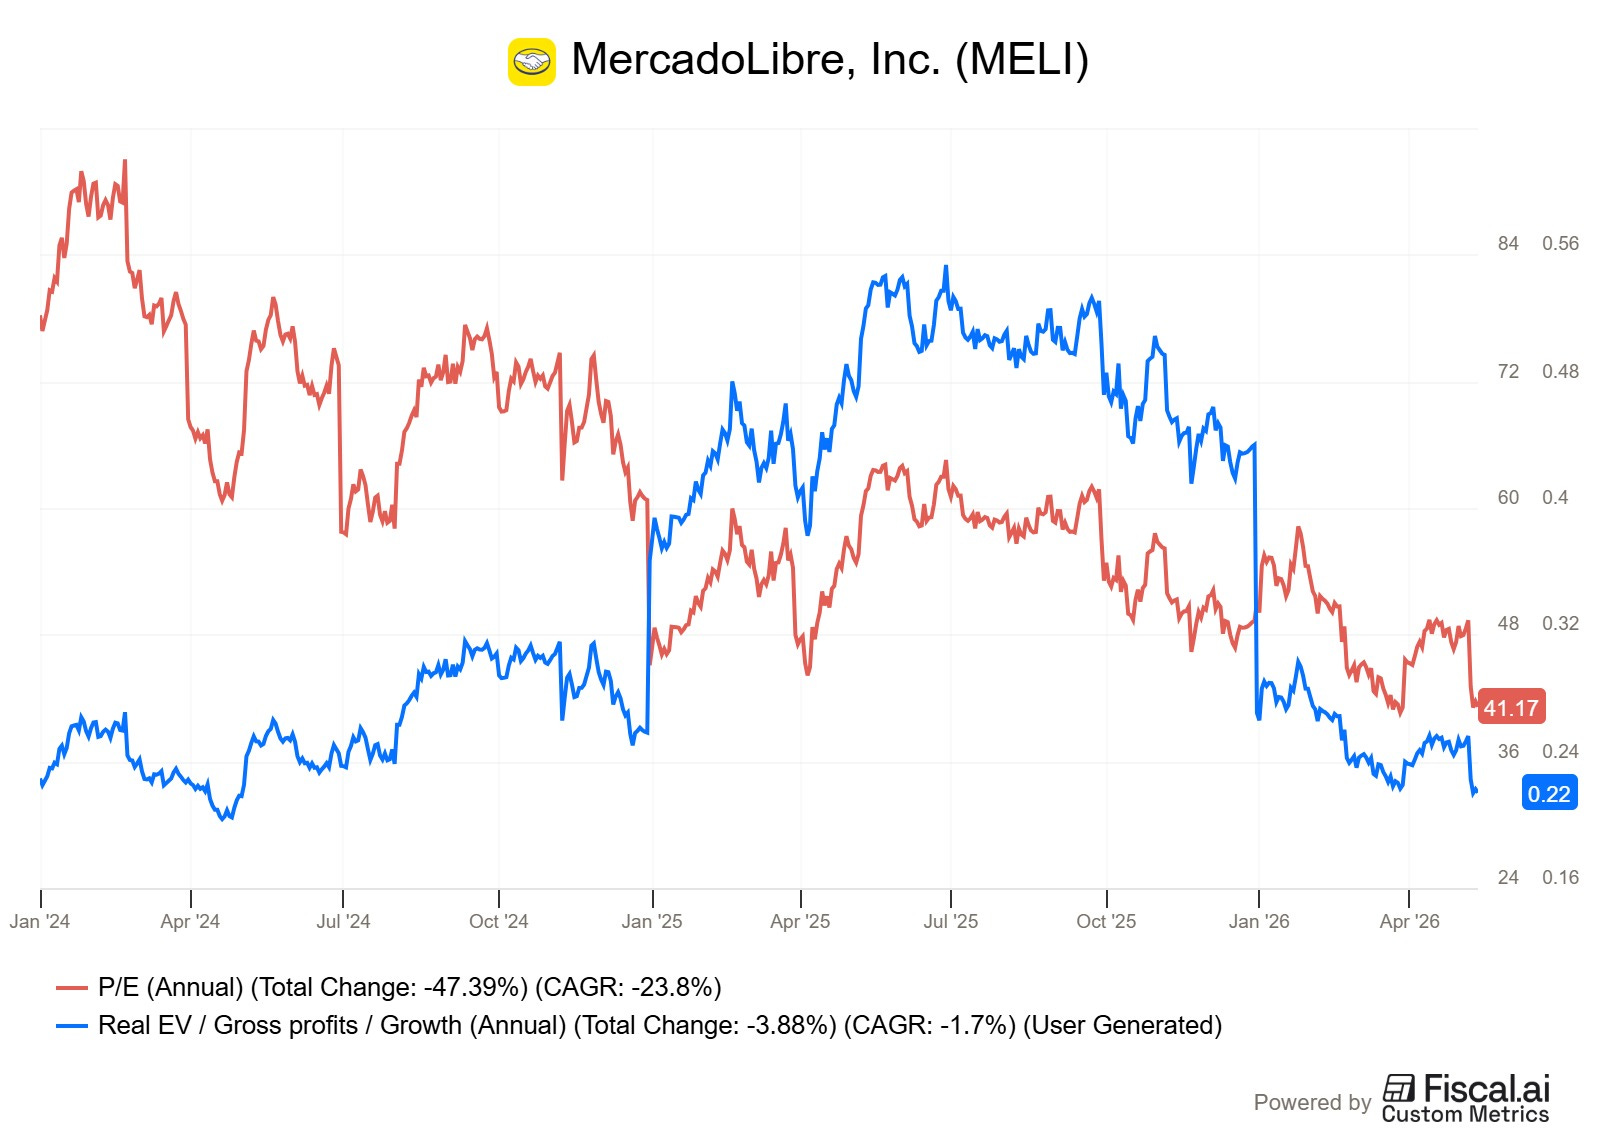
The P/E ratio tells you, it’s still high, but the cheapest ratio at which MELI has ever traded
Our EV/GP/G ratio tells you it’s priced back as in the downturn in 2022
We took gross profits as so much is going on below that line in the income statement, that it’s the “cleanest representation” to the past.
So we love this: Custom Metrics
2 Business owner mode
When we buy companies in the public market, we should approach it as if we’re buying a private company.
When you’re interested in buying a local company, you don’t know what the price is at the start of your due diligence. You cannot be influenced by the price.
That’s not the case in public markets.
But fiscal has a solution: owner mode.
Here’s the normal view you get when you select a company:
Now when you select “owner’s mode” in the settings.
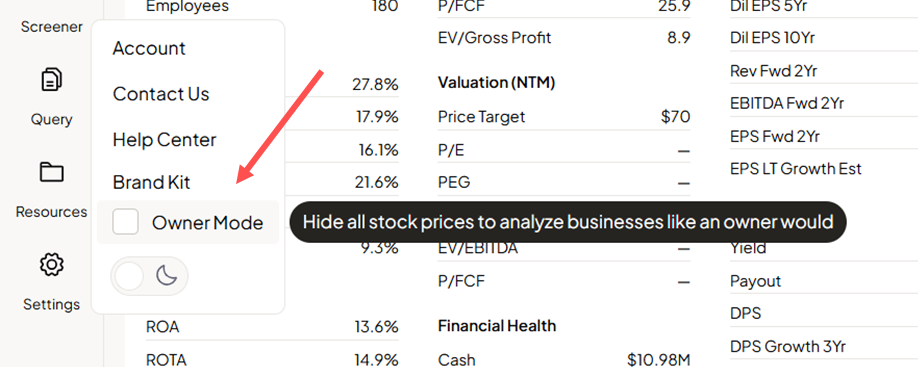
You get the following view:
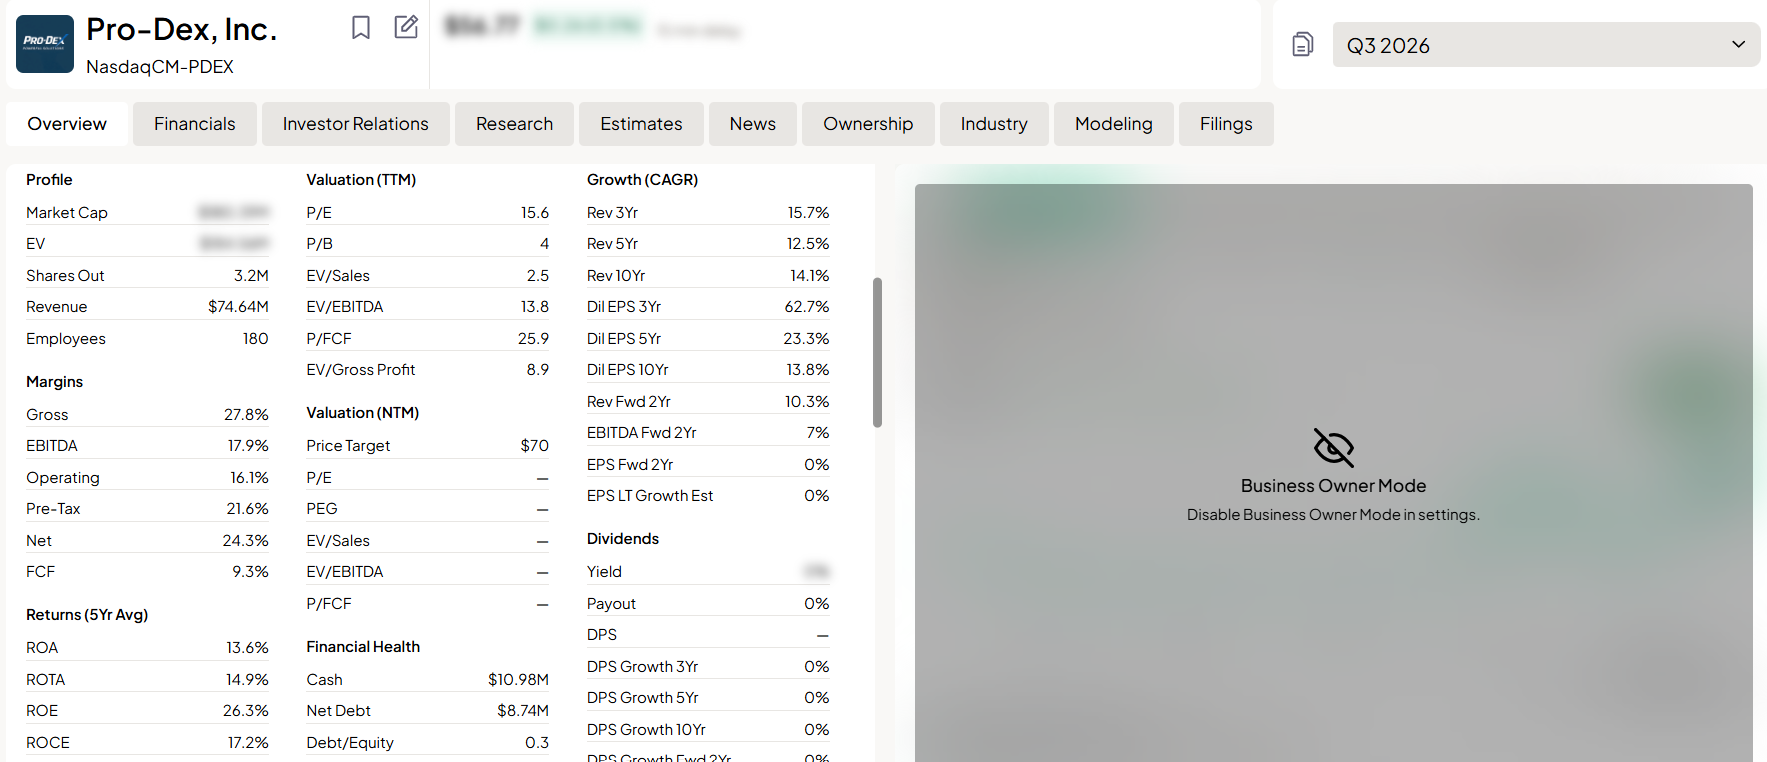
Metrics related to pure price are masked.
I don’t know which other tool can do this.
3 Awesome Customer Service
They still have real customer service.
Why real, because yesterday, I was battling with an AI Chatbot from Paypal and wanted to shoot myself in the head. (stuff for another discussion, but creating a business account on Paypal was an absolute nightmare.)
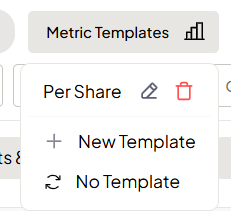
And when I use my Custom Metric “per share” template
This is what fiscal shows me:
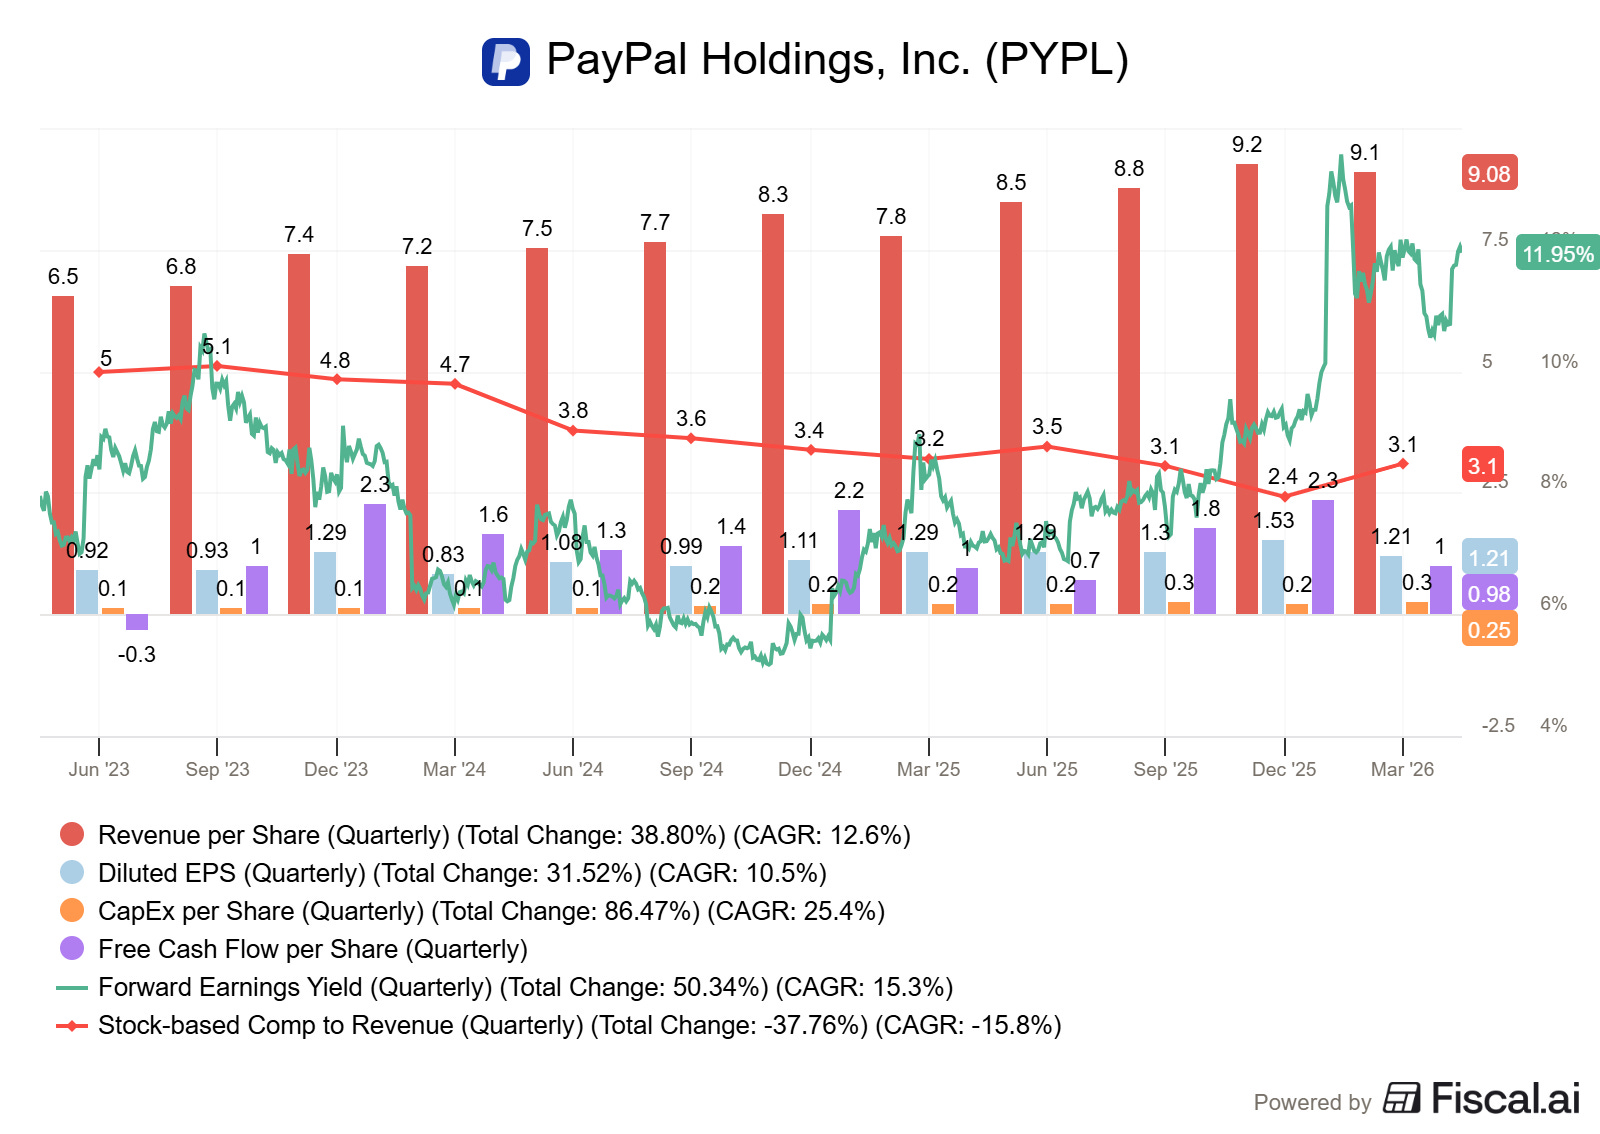
The past metrics don’t look that bad. I in fact you have growth at 10% in diluted EPS, but earnings yield growing at 15%. So the business has become more profitable AND “cheaper” at the same time.
But cheaper doesn’t mean cheap.
Forward earnings yield sits at 12%, but Paypal seems to have a growth problem. These are quarterly results. Look at the Q1 FCF/share result for each year:
Q1 2024: 2.3
Q1 2025: 2.2
Q1 2026: 2.3
But i’m straying of course. That’s not what I wanted to talk about.
I had a question about using those custom metrics, and within 12 hours, I received a reply by mail:

And it seemed it was me who was at fault by the way. I was using it wrong.
The cherry on the cake.
Even the CEO replies to questions.

This is not an invitation to start asking questions like this to the CEO. I admit, I was a bit too forthcoming 😉
4 Breath of data
We invest in microcap companies worldwide. That means we want worldwide data.
We are invested in the US, Canada, Australia, the UK and Japan.
And even in the UK, on the small AIM market, fiscal has the data.
It has never let us down in the breath of data it has. Over 50,000 companies (and ETFs- worldwide).
5 The one thing that bothered me
When I use software, I want speed. It needs to feel snappy.
Even waiting several seconds for a company to load is too much for me.
And in the past, fiscal.ai was not the fastest.
But again, they listened to their customers.
You can try out their free plan, and test it for yourself.
Conclusion
This is just a small glimpse of what fiscal has to offer.
Their 25% off sale is ending in about a day.
You can still profit from their offer. And if not, which tool are you using and why?
May the markets be with you, always!
Kevin
Atomical Capital
Note: Full disclosure, the link above is an affiliate link. If you decide this software to be useful and buy a subscription with fiscal, that will help this newsletter.
Fiscal is a wonderful tool, I use it myself on a daily basis as well. Thanks for sharing this, found something new with your custom metric! 👏🏻
I use the second tier paid version (pro I think), true about customer services they do respond quickly. Screens are a nice layout to navigate around.
My only negative so far, is that you are unable to download from your own set up screener tabs, . Would be nice to download to Google sheets, filter out some more . I have asked customer services they haven't got this option yet, although you can on their dashboard